Usage
Account Managing
Experiment Package
In the following section, the structure of a zipped Experiment Package will be explained. Please note that each and avery file listed below can be created and modified from your Home Page direclty, with no need to manually adjust them from outside PathLay. Each Experiment Package is defined from up to 7 different text files with different extensions:
File Extension |
Content |
|---|---|
.conf |
Holds the main configuration of the Experiment Package |
.mrna |
Holds the Transcriptomic dataset |
.prot |
Holds the Proteomic dataset |
.mirna |
Holds the miRNomic dataset |
.meth |
Holds the Methylomic dataset |
.chroma |
Holds the Chromatin Status dataset |
.ont |
Holds the Gene Ontologies entries of interest of the Experiment Package |
.meta |
Holds the Metabolomic dataset |
Every experiment created in your Home Page has a name like “exp1,2,3…” automatically assigned. If you want to manually configure an experiment from scratch you have to name your files with this convention in mind (i.e. exp1.conf, exp1.mrna, exp1.meta etc…).
Database Configuration
Database configuration is accessible only from the host machine where PathLay is installed, this is due to avoid that many users in parallel can run it. It is a crucial step to be performed to make PathLay usable and it articulates as follows:
Select the organism to Configure
Check for files regarding components interactions
Check for pathway files
Warning
There could be problems during the installation. If that happens please refer to the Alternative installation section.
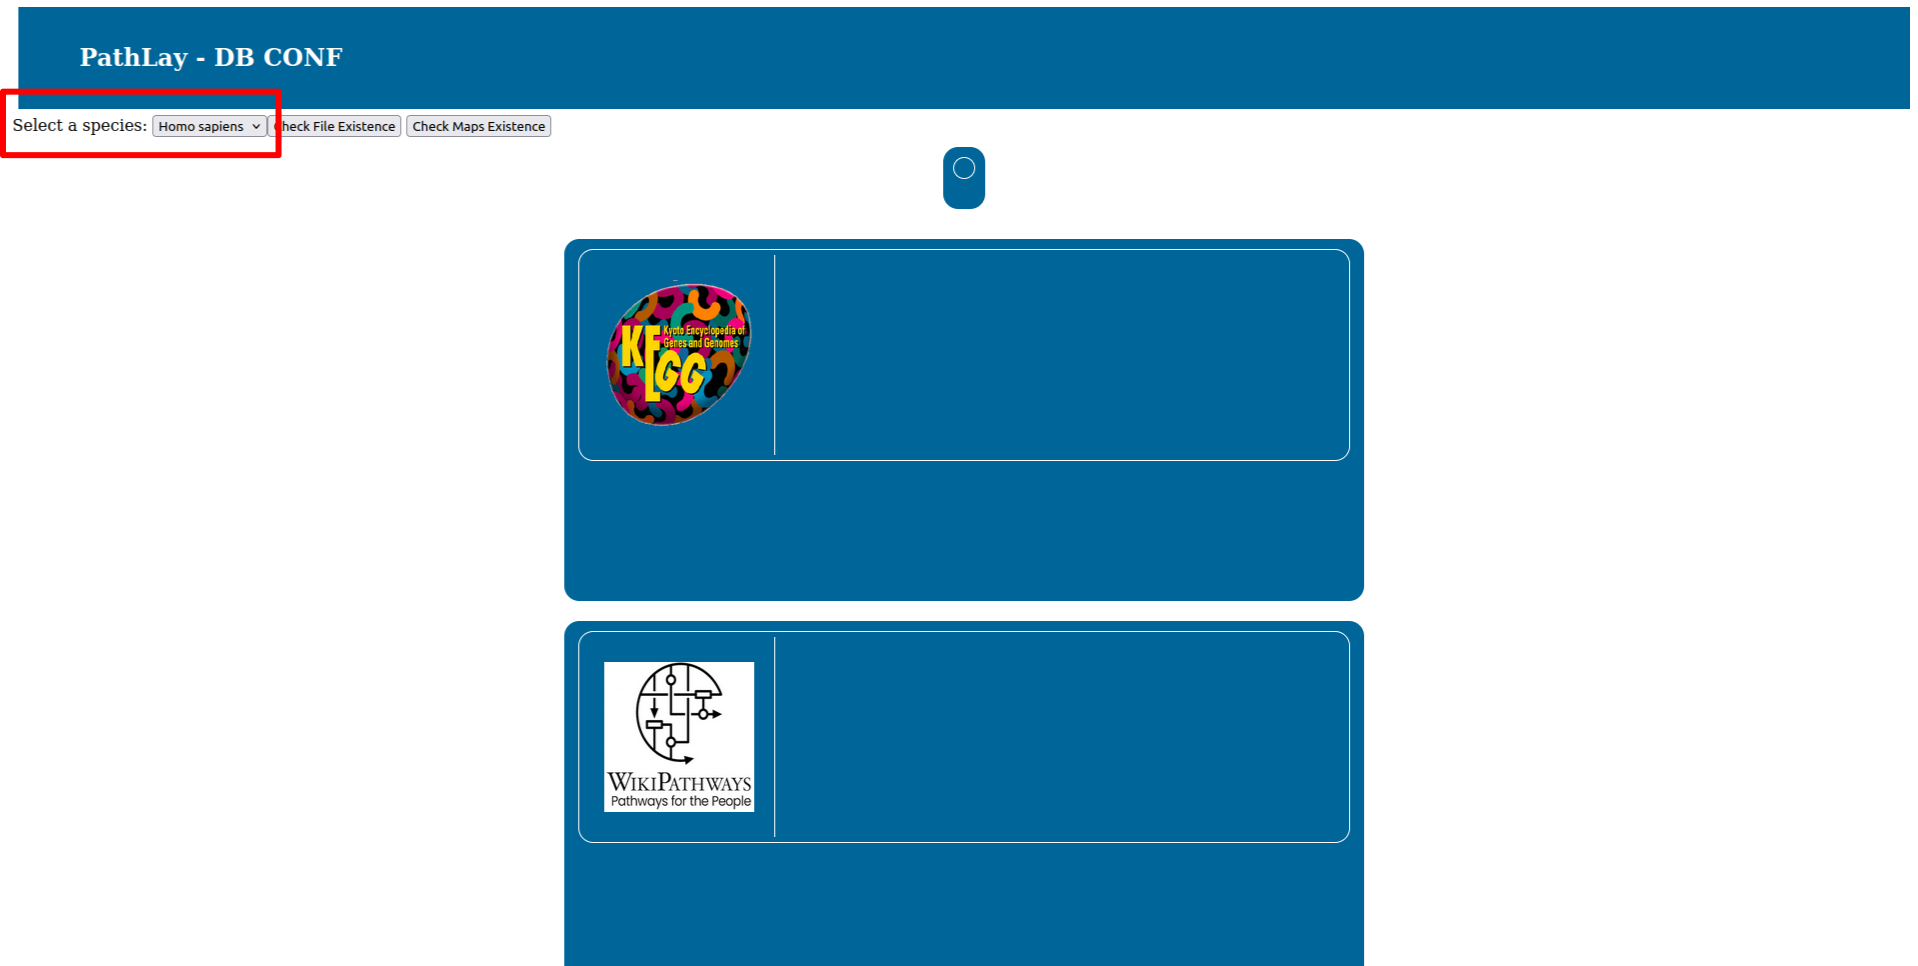
Organism Selection
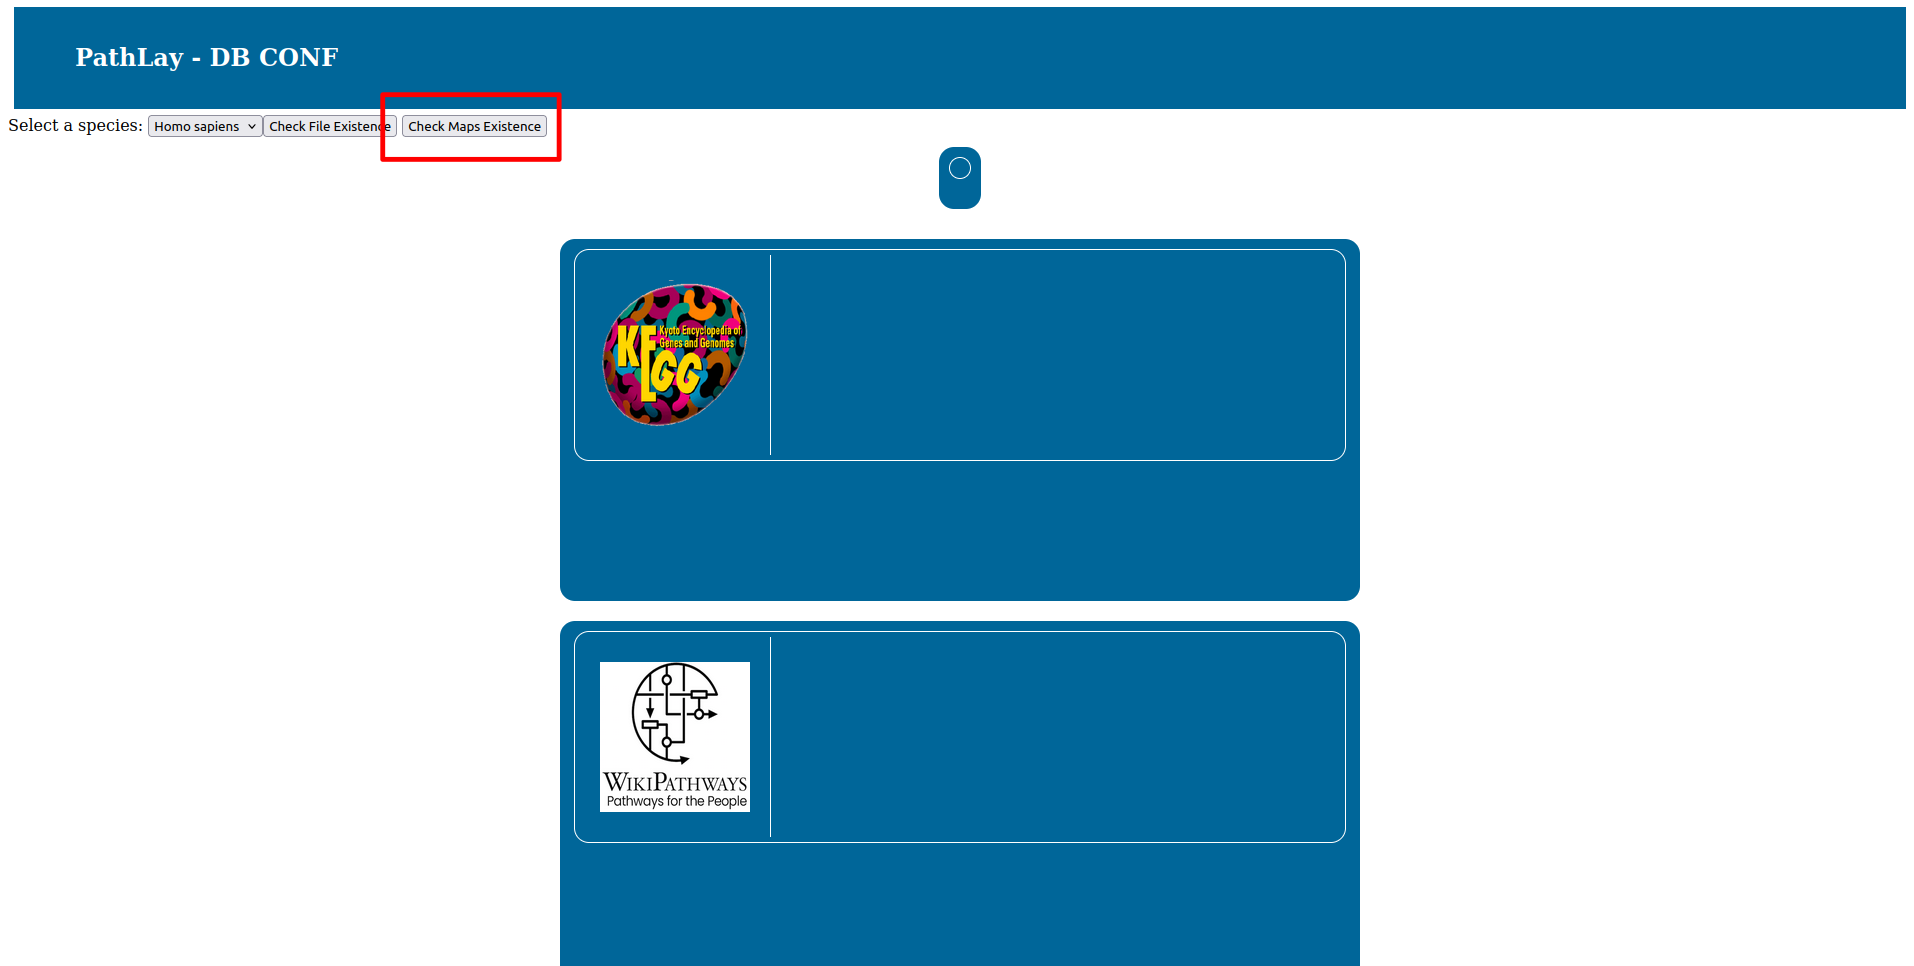
To select the organism database to configure use the selector on the top right. At this stage PathLay supports only Homo Sapiens and Mus musculus.
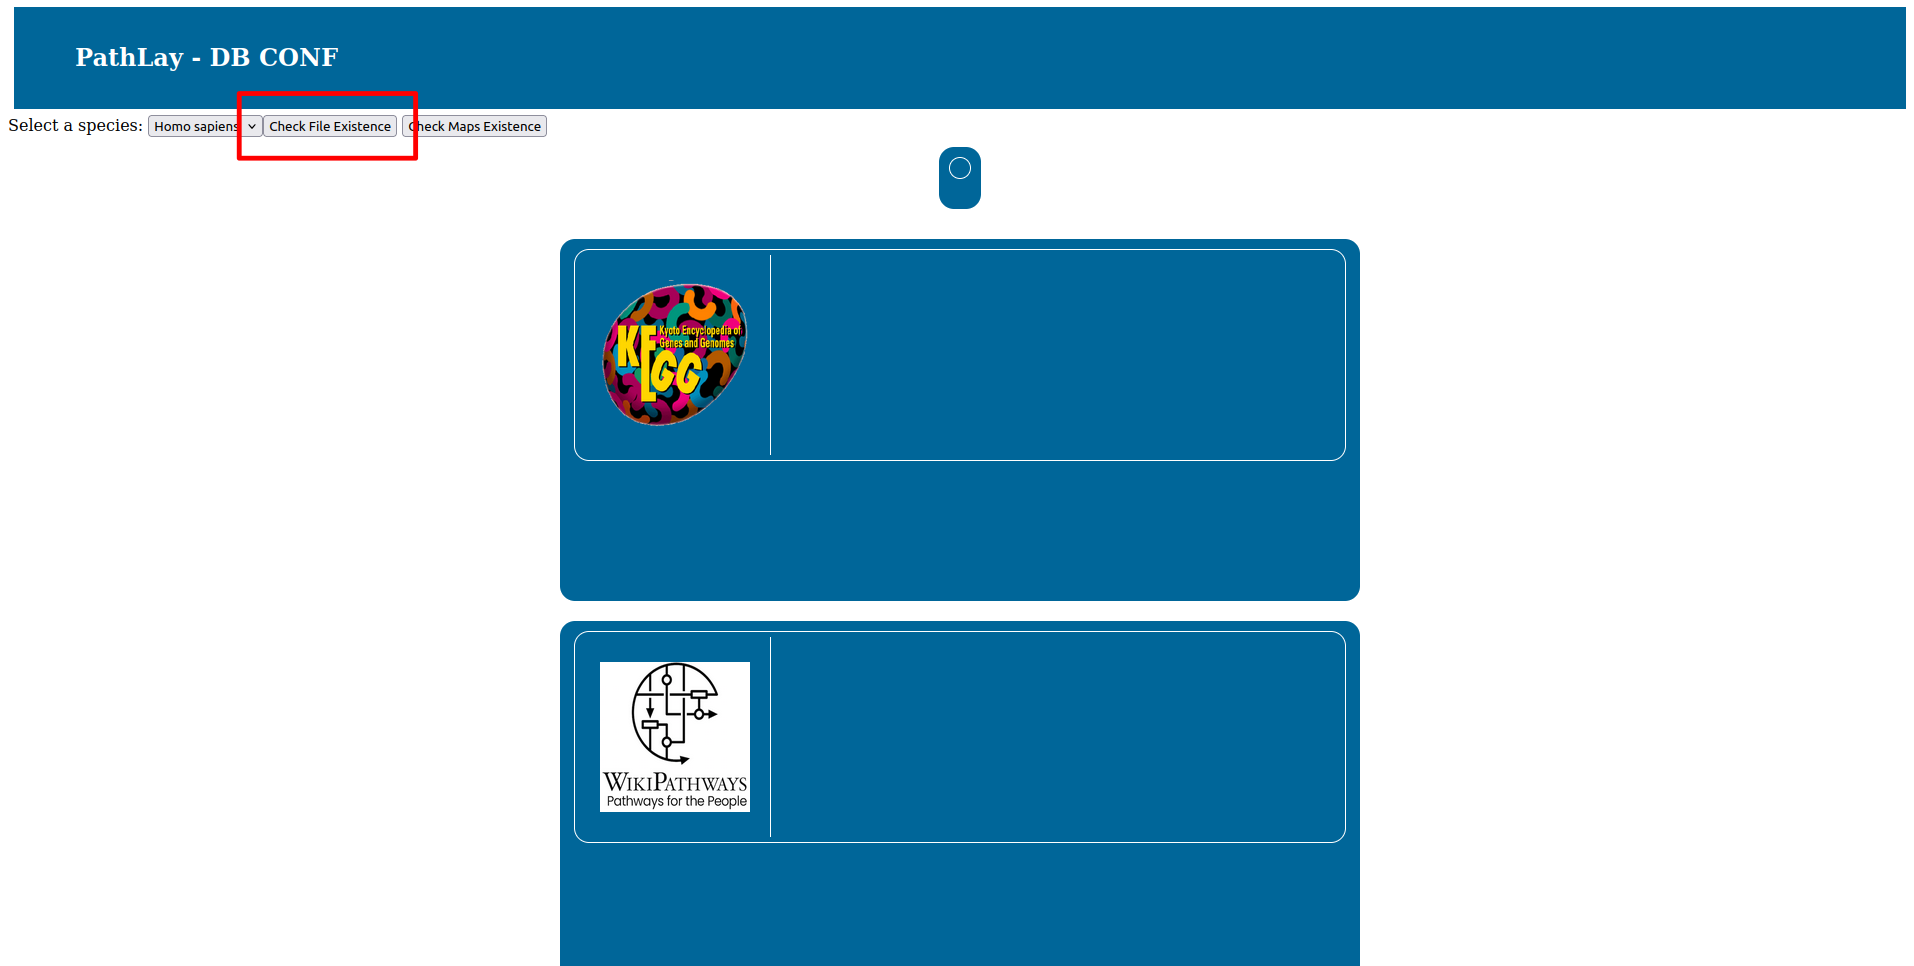
Interaction Files
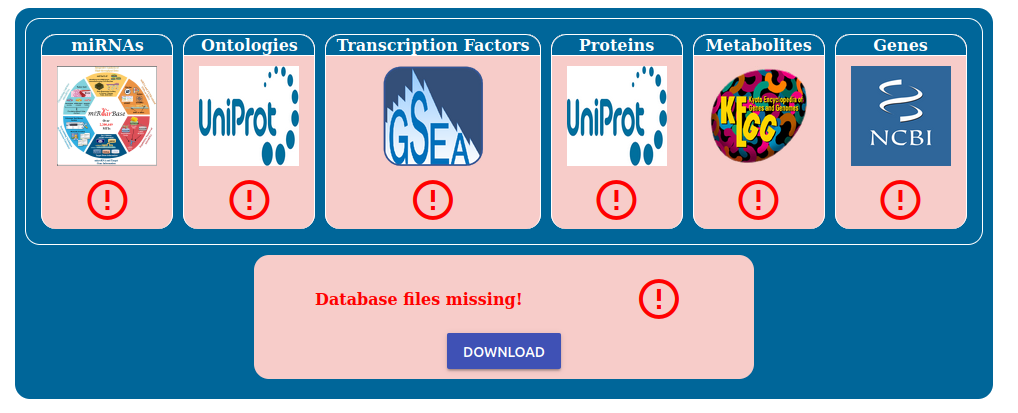
Press the “Check File Existance” button to check if the database is ready. On your first installation of PathLay of course this will result in all files missing, as reported by the red boxes.
To begin the installation process click the “Download” button and simply wait for the downloads to finish.
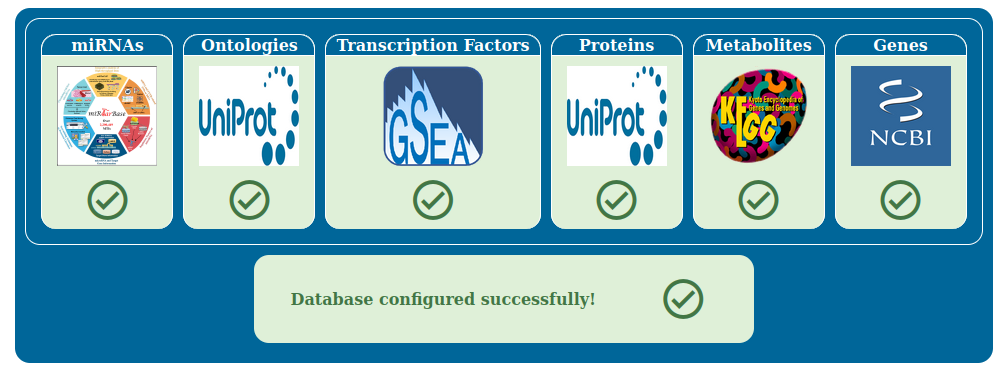
Once all the downloads are done, the boxes will turn green and you can proceed to the next step.
Pathway Files
Press the “Check Maps Existance” button to check the pathway database status. Pathway databases supported are KEGG and WikiPathways. On your first installation of PathLay of course this will result in all files missing, as reported by the red boxes.
To begin the installation process click the “Download” button and simply wait for the downloads to finish.
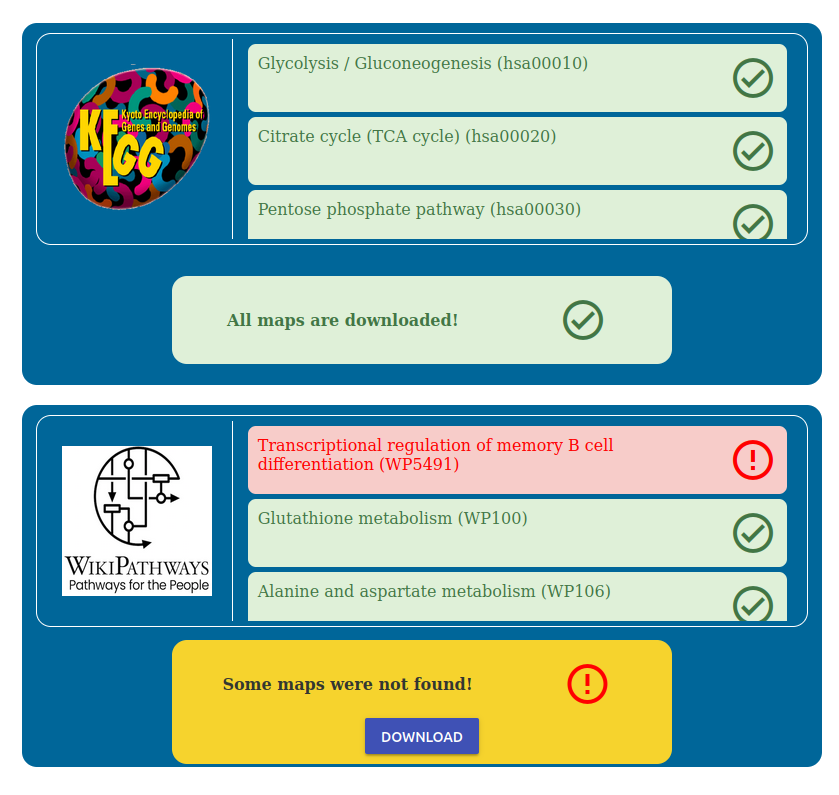
You can monitor which maps are being downloaded in the corresponding box.
Note
Downloading may take some time, and it is recommended to download one database at a time for a smoother process.
Alternative installation
If the online databases are not responding due to technical issues or the configuration page doesn’t function as expected, you can manually install the required data. We have provided a GitHub repository with a pre-configured database.
To use this alternative:
Access the repository here.
Download the pathlay_data folder.
Overwrite the pathlay_data folder on your system with the one from the repository.
Home Manager
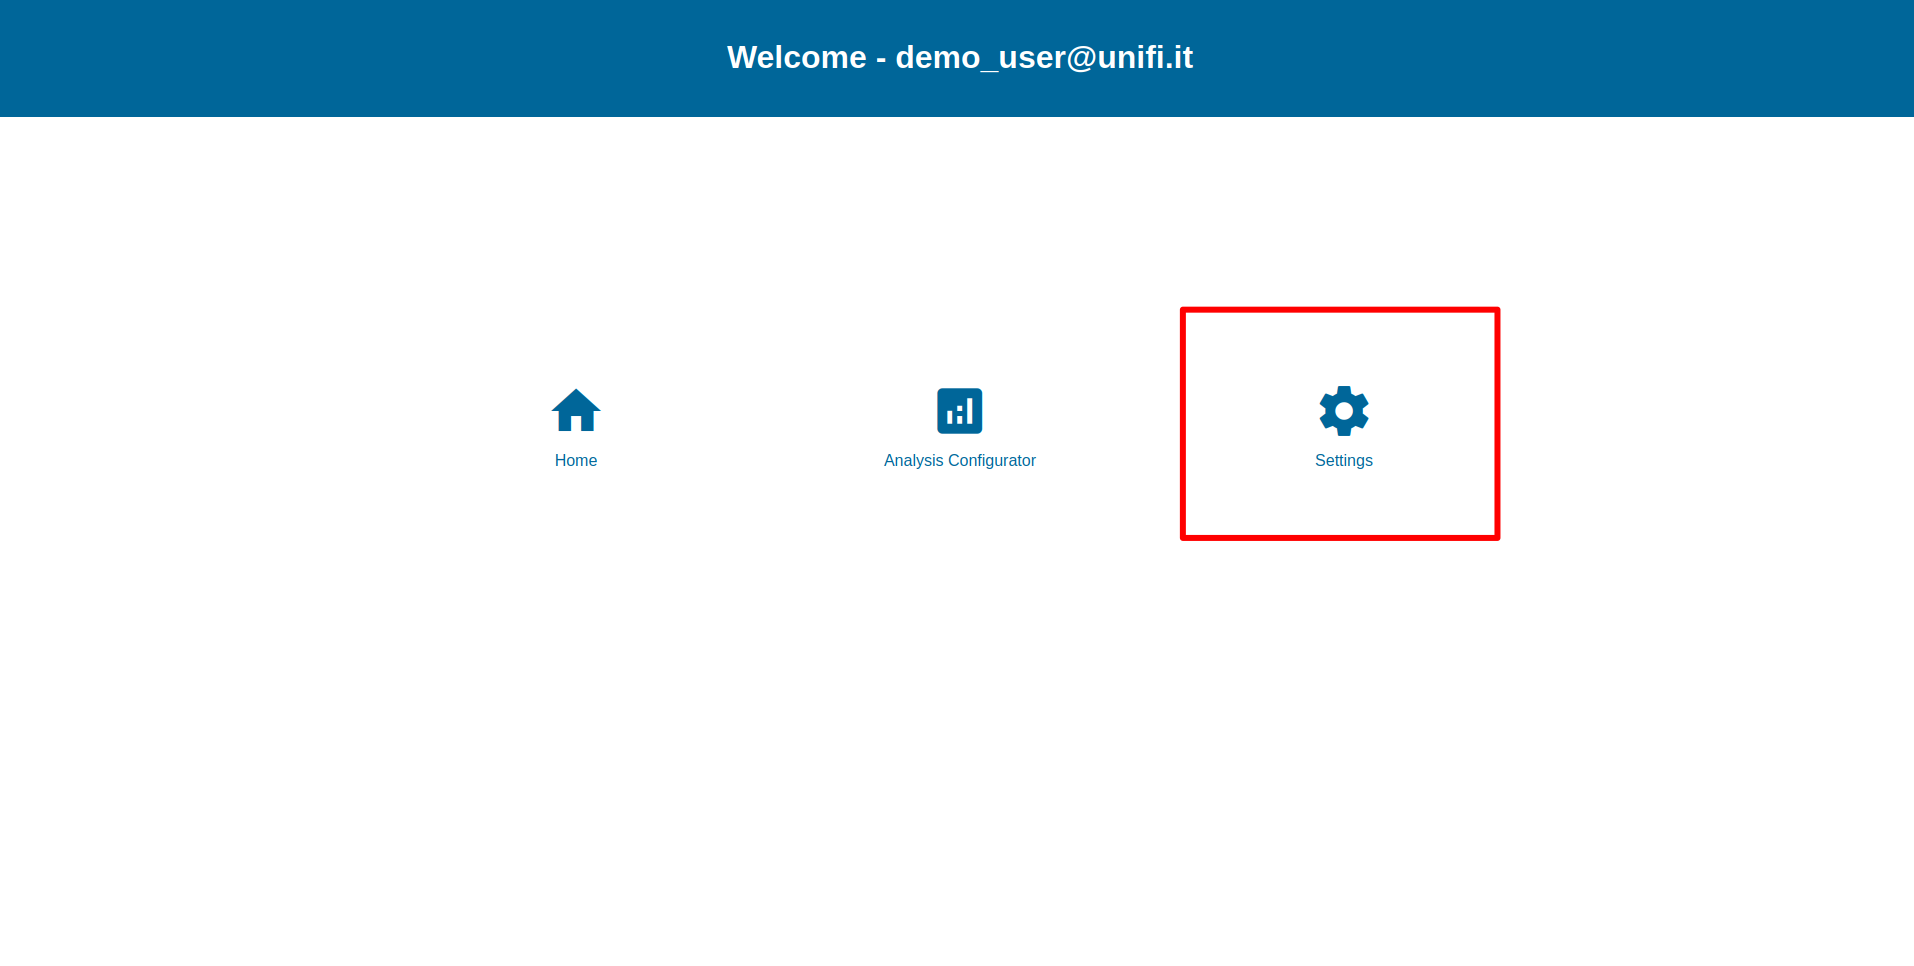
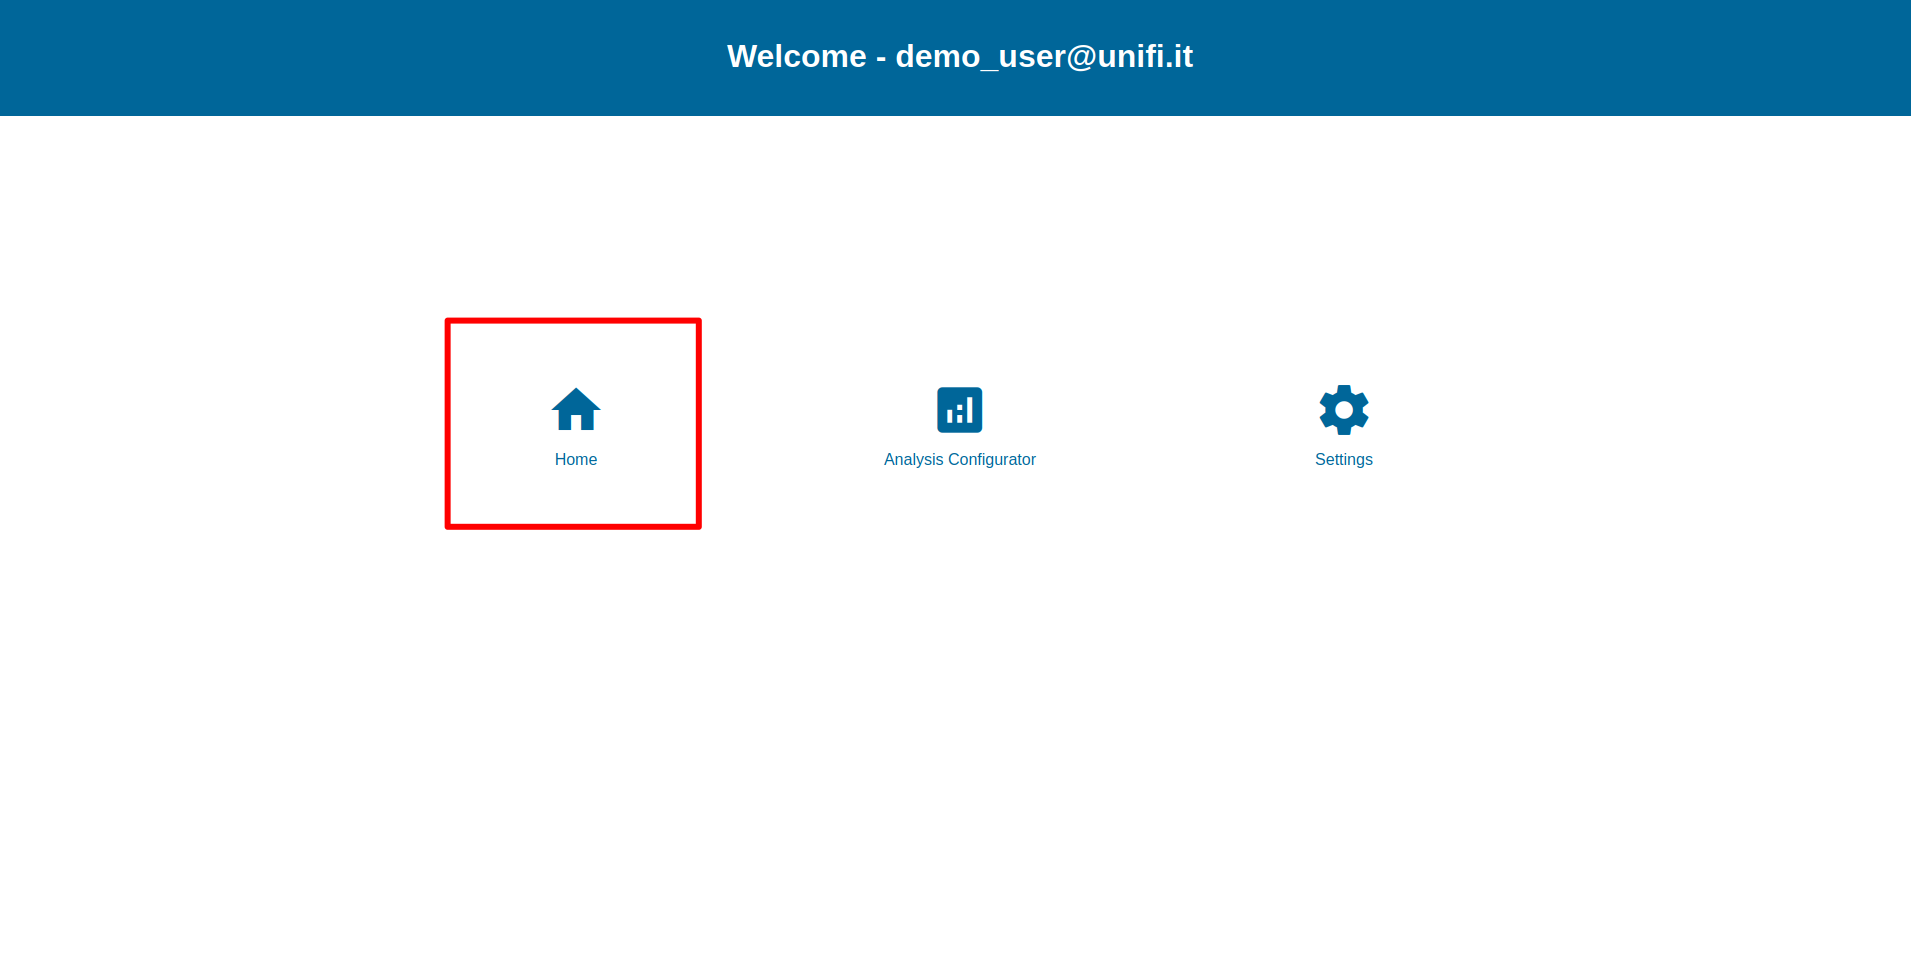
The Home section is accessible by clicking the “Home” icon from the Welcome page. In the Home Page you can create, load and modify an Experiment Package with a more intuitive approach.
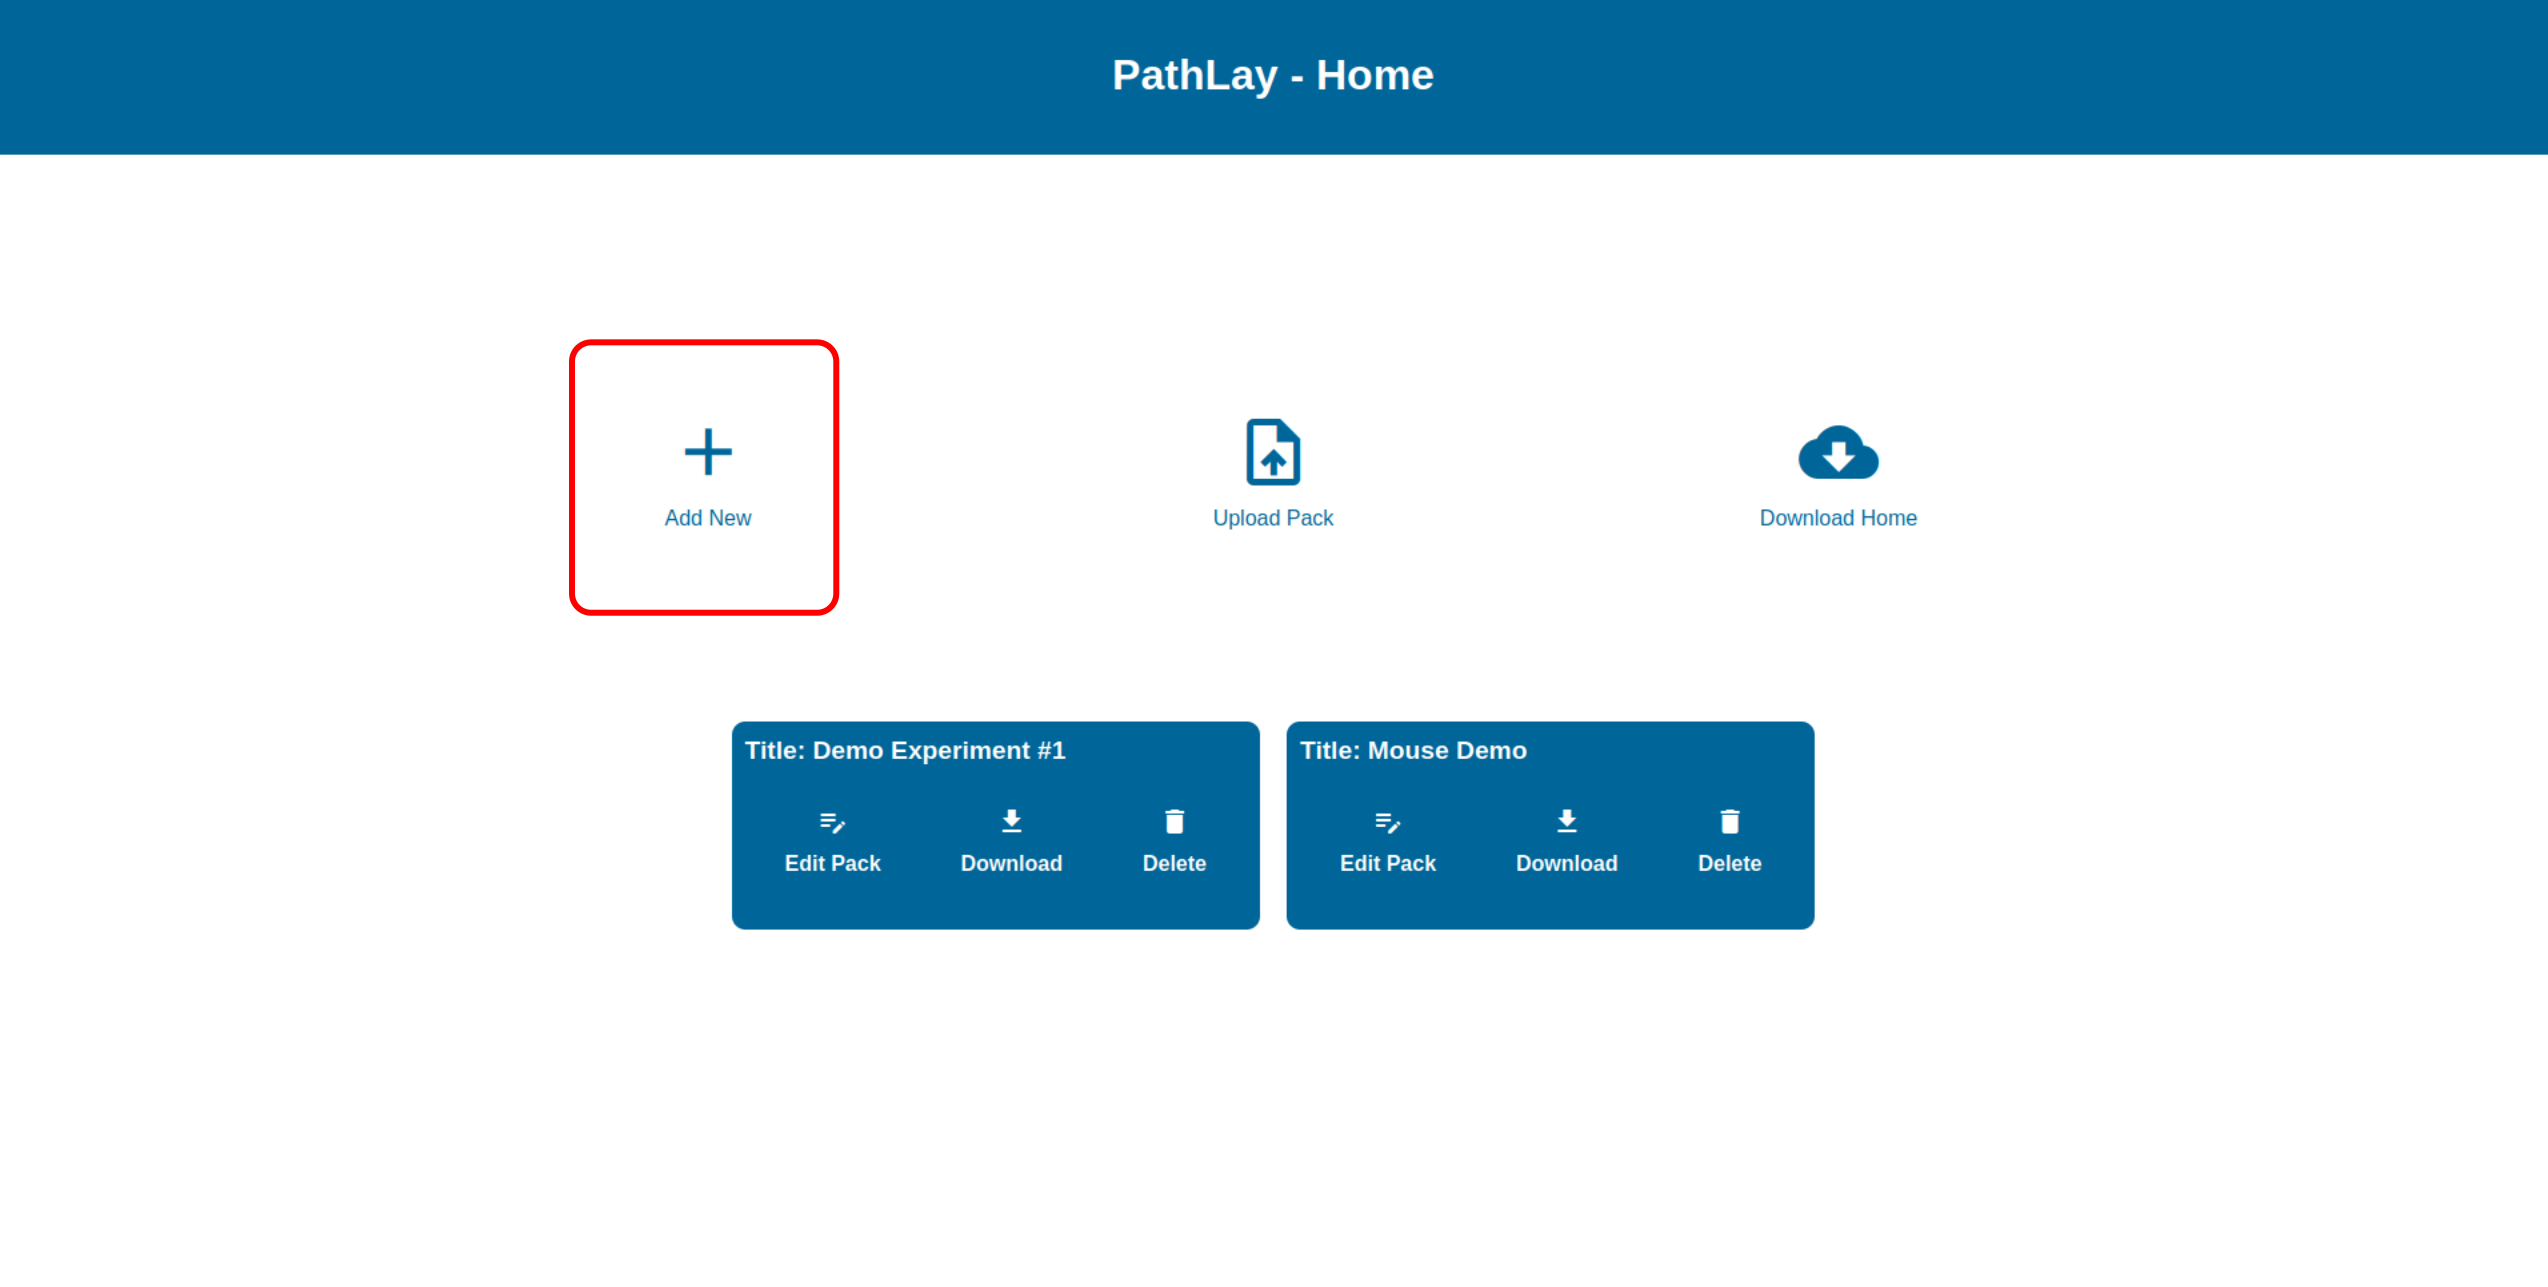
Adding a new Experiment Package
To create an Experiment Package from scratch the first thing to do is to click the “Add New” button.
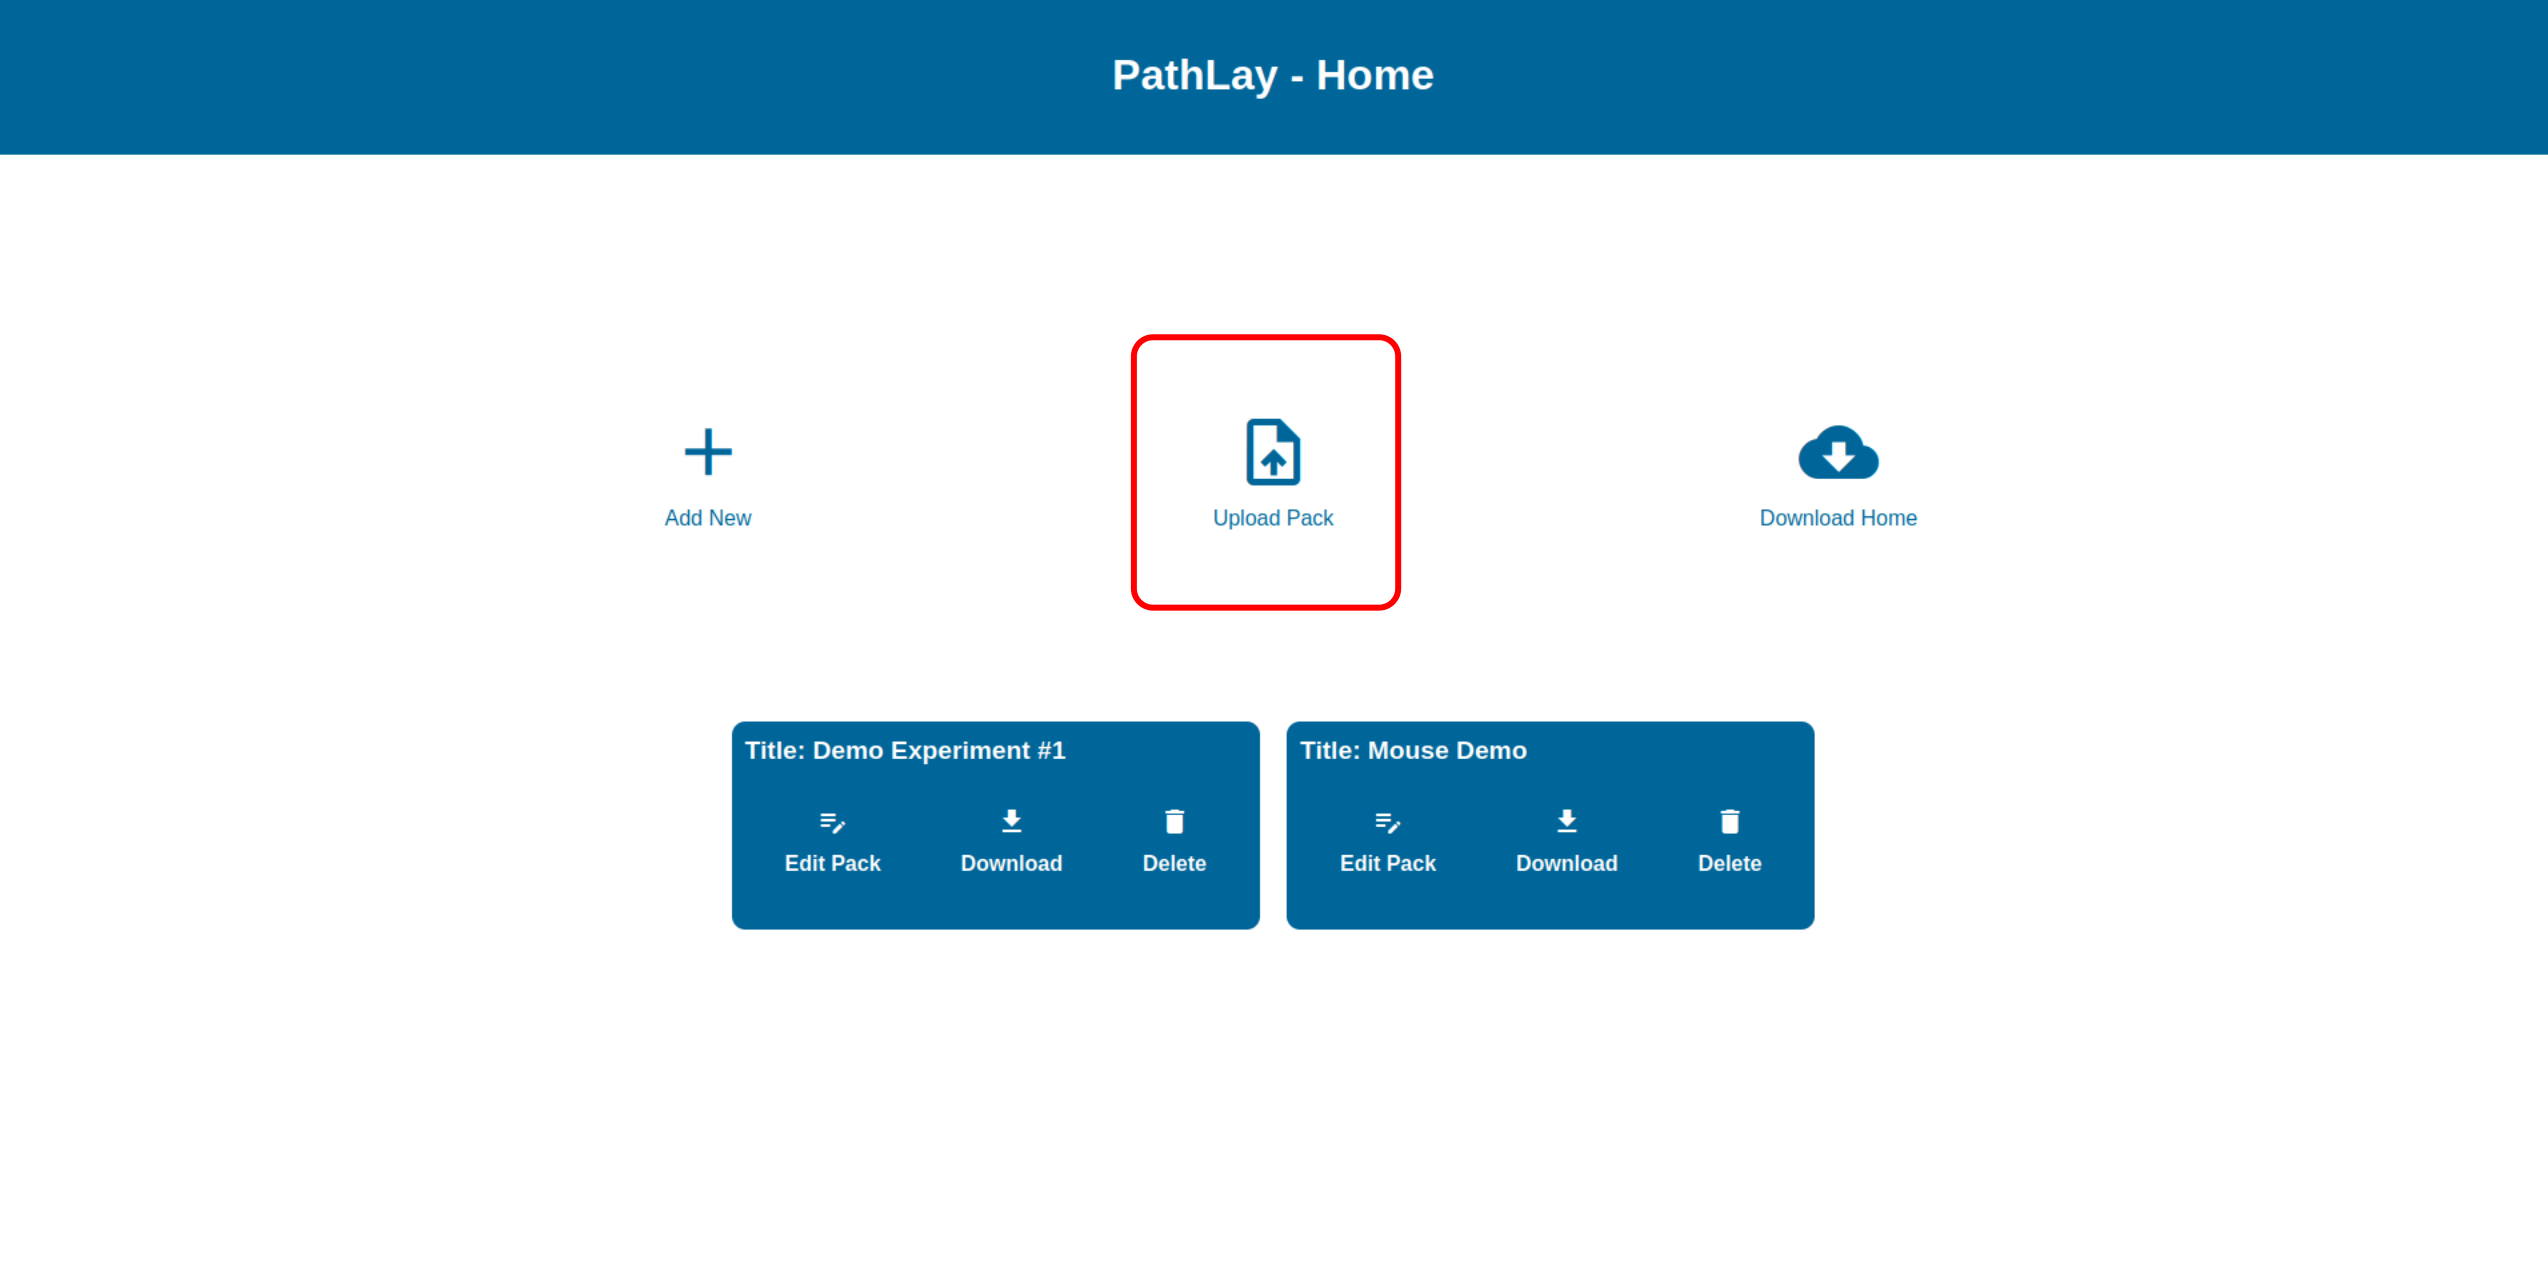
Uploading a new Experiment Package
To upload an Experiment Package the first thing to do is to click the “Upload” button.
Editing an Experiment Package
To edit the configuration of an Experiment Package, click on the “Edit Pack” button on the package’s blue box in the Home section. You will be redirected to the configuration page.

The configuration articulates in three sections, explained in detail in the following sections:
General information editing and reference organism assigning
Dataset configuration
Ontologies selection
After the editing is complete you can save the configuration by clicking the “Save” button.
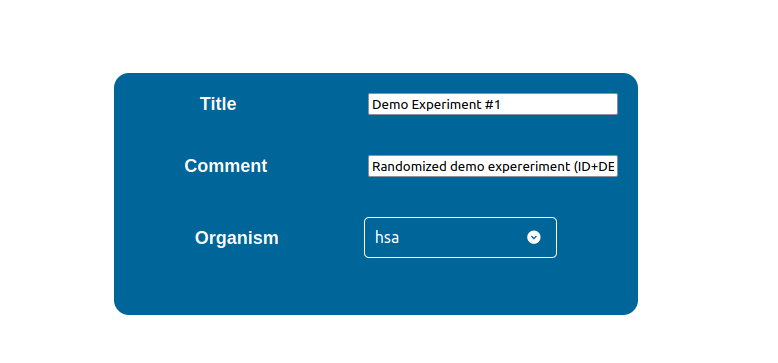
Edit Experiment’s General Information
By editing the first section in the configuration page you can perform the following:
Assign a title to the package
Assign a reference organism to the package by selecting it from the “Organism” selector.
Write a comment
Configure a Dataset
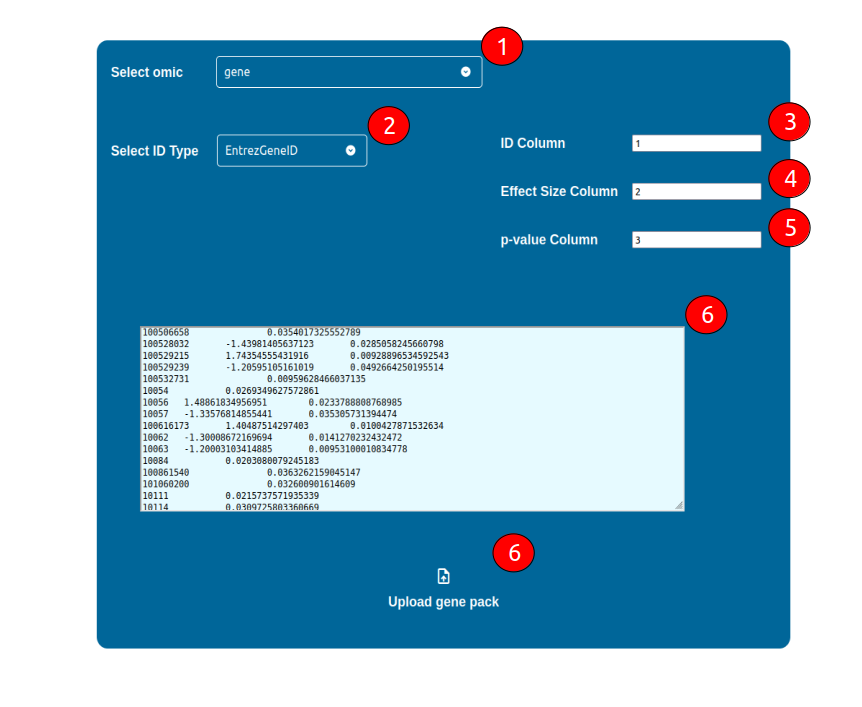
The configuration of a dataset requires the following general steps:
Select what -omic science is representative of the dataset by using the “Select omic” selector
Select what kind of ID is being adopted in your dataset
Select which column is holding the IDs
Select which column is holding an Effect Size Static value (e.g. logFC), if any
Select which column is holding a p-value, if any
Upload your dataset in a tab-separated text format by either copy and paste it in the coloured text area, or by uploading it using the “Upload {omic} pack” button below
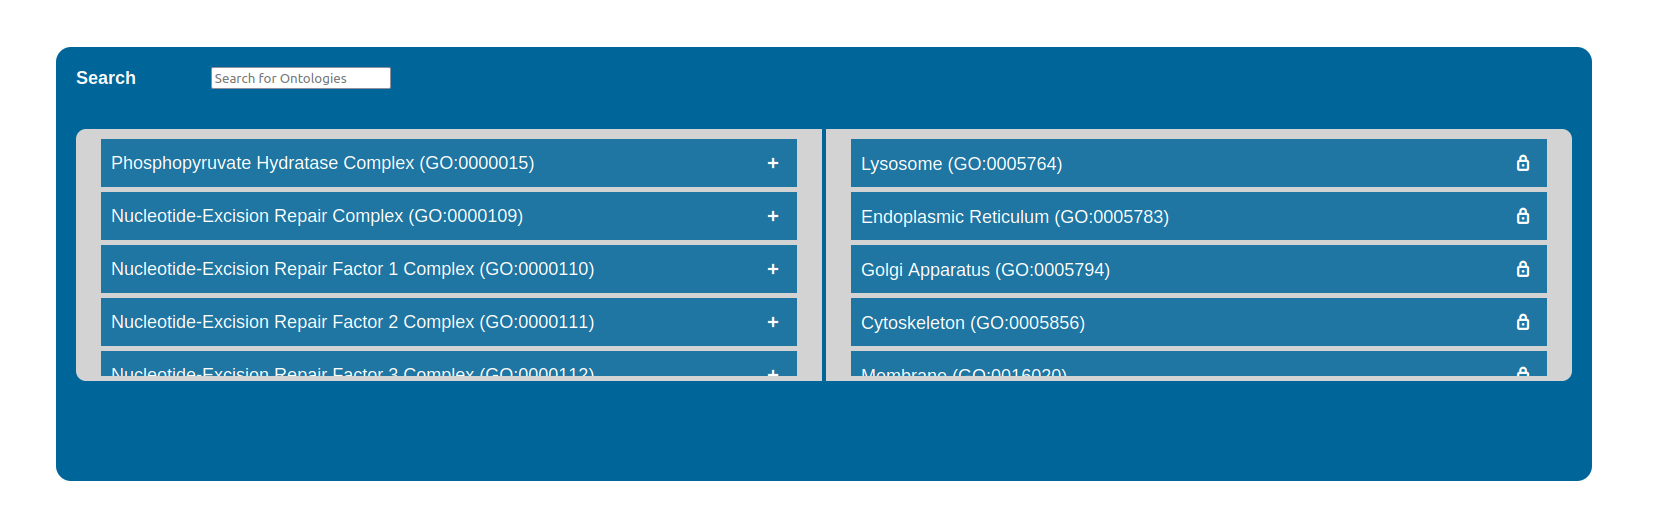
Gene Ontologies
Your Home Page also provides a list of cellular compartments that are nothing less than Gene Ontologies. Each one of the entries represents a gene list of Entrez Gene IDs and you can select the ones you are more interested in by clicking the “+” button located on the right side of each box. A search box is also provided to filter the ones you are most interested in. Gene Ontologies of interest will be added to the other list alongside the preselected ones: Nucleus, Cytoplasm, Mitochondrion, Lysosome, Endoplasmic Reticulum, Golgi Apparatus, Cytoskeleton, Membrane. You can of course remove them by clicking the “-” button in the selected boxes. Cellular compartments selected will be found in a dropdown menu after PathLay has completed the analysis and it’s ready to show the results on functional pathways. Once a cellular compartment is chosen, only genes and proteins localized in that compartment will remain displayed on the pathways (see more “Pathway Explorer”).
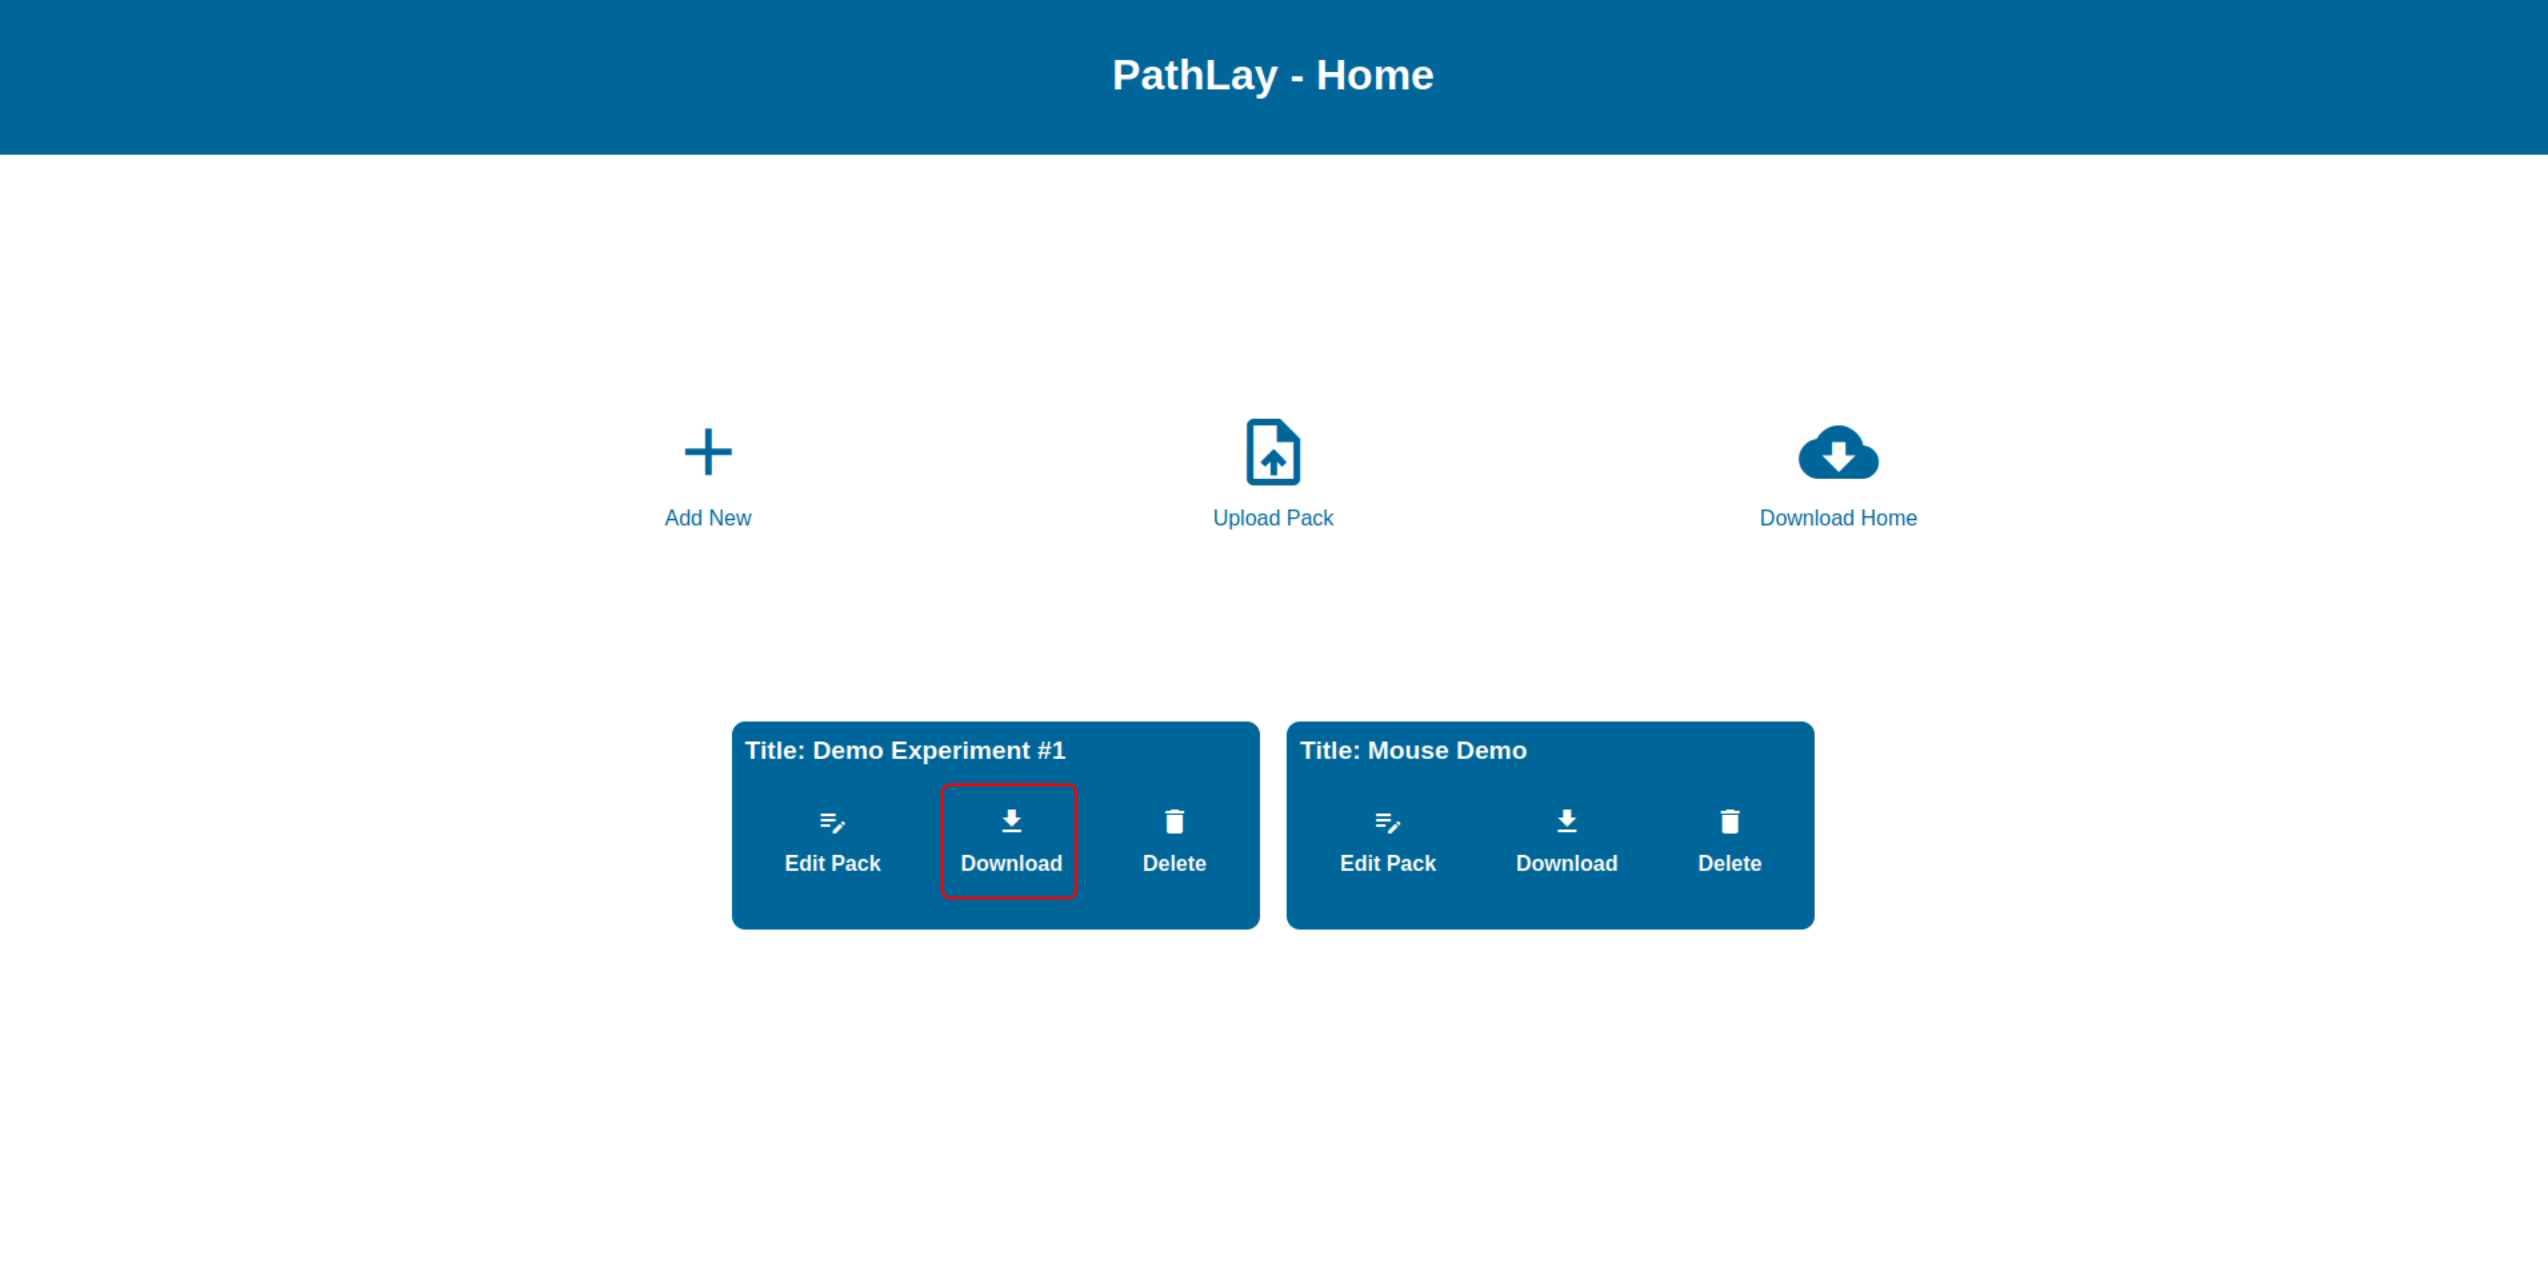
Downloading an Experiment Package
The “Download” button allows you to package the currently loaded datasets and configurations in a zip archive and export it from PathLay for other uses, for instance, this archive can be uploaded as a new Experiment Package into another PathLay account.
Configuration Page
The Configuration Page is accessible by selecting “Analysis Configurator” in the Welcome page and then clicking the “Configure Analysis” button for the desired Experiment Package. If it isn’t the first time you do this, you can also skip the configuration step and run PathLay with the last configuration available by clicking “Run Last Configuration”.
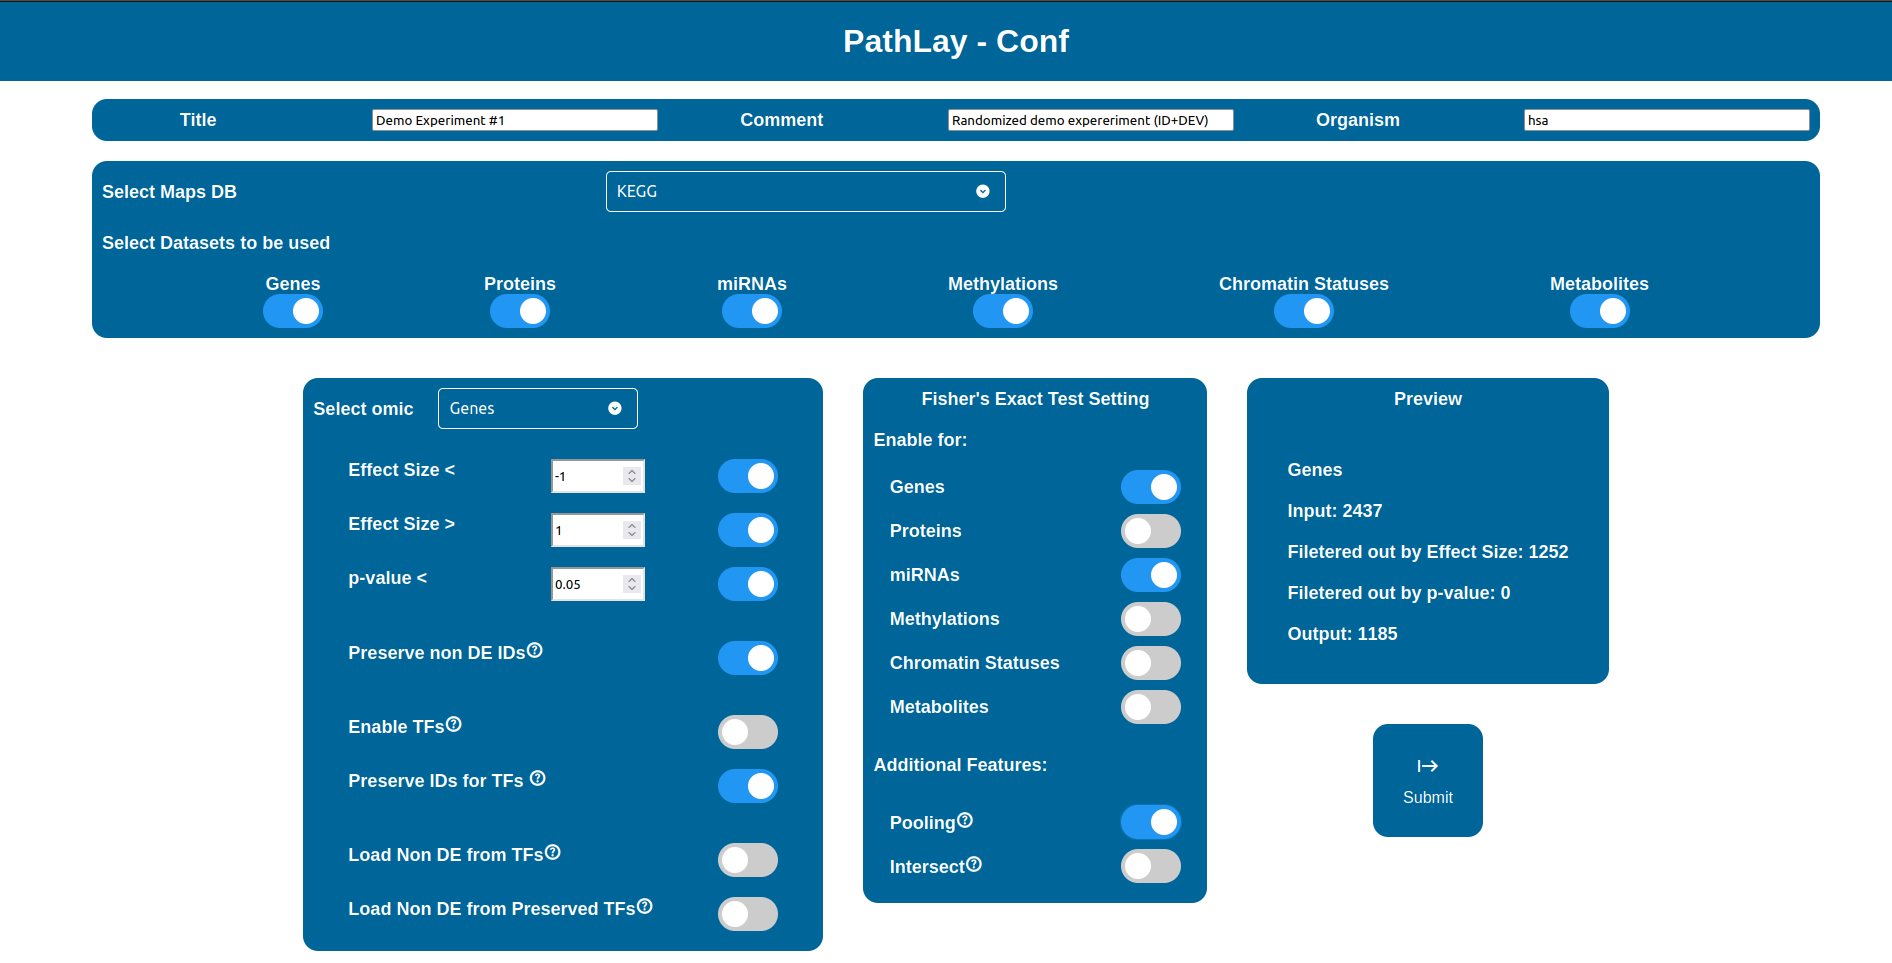
The “Select Maps DB” selector allows you to choose which database will be used to load pathways from.
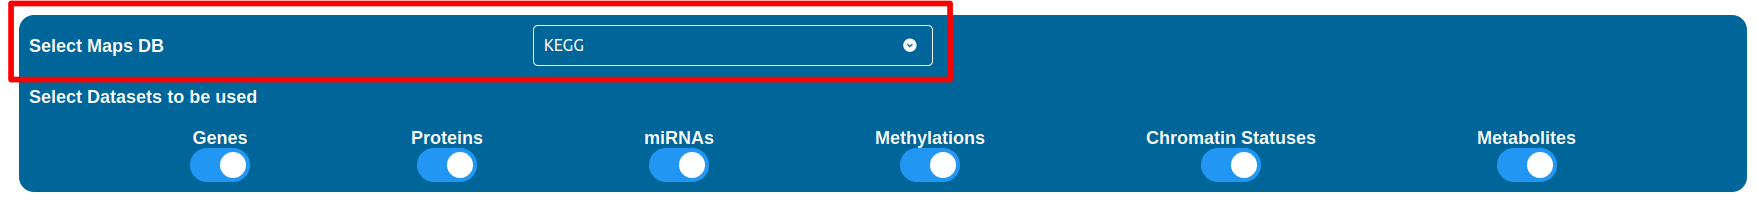
Screenshot of the “Select Maps DB” interface in the data selection step.
Note
Databases supported may vary depending on the reference organism selected, as it is now PathLay supports only Homo sapiens and Mus musculus which are both supported by KEGG and WikiPathways.
The “Select Datasets to be used” selector allows you to select the datasets you want to use by simply check the boxes you are interested in between “Genes”, “Proteins”, “miRNAs”, “Methylations”, “Chromatin Status” and “Metabolites”.
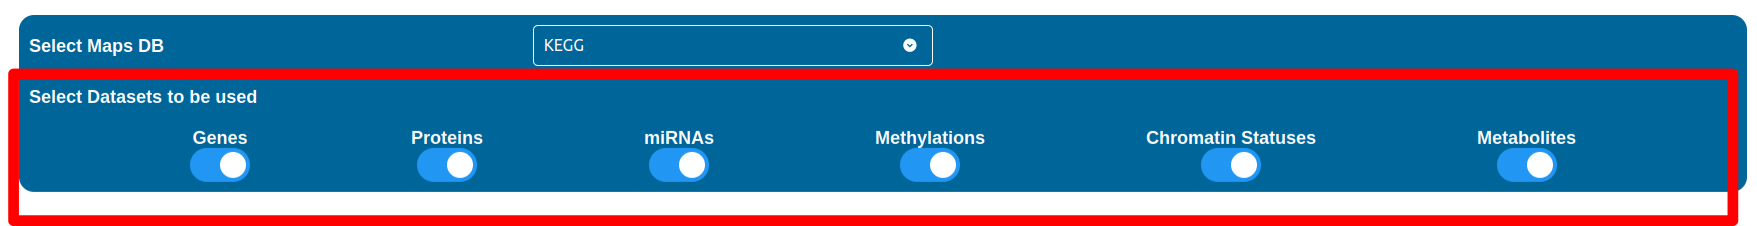
Screenshot of the “Select Datasets to be used” interface in the data selection step.
Warning
Whenever a checkbox is disabled, it means that either the dataset was not found available or that the setup in the Home page was not performed accordingly (i.e. the content of the columns was not pointed out correctly).
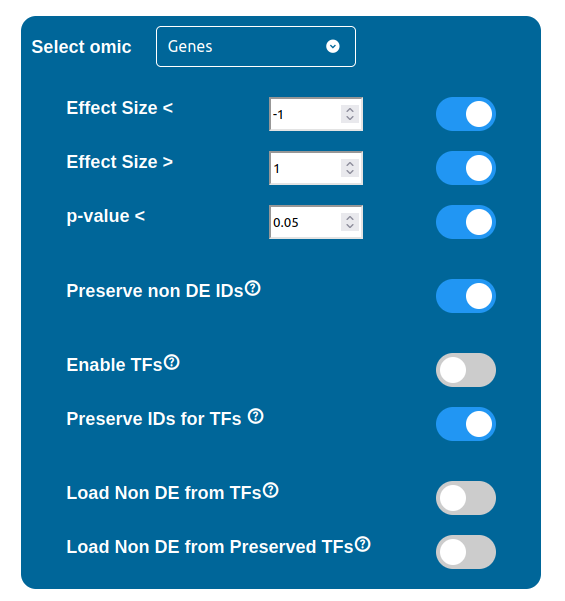
Using the “Select omic” selector you can switch between the filtering configurations available for each dataset. Some of these configurations are common to every data type, while others, related to the Transcription Factors (TFs) and the Non Differentially Expressed components (NoDE), are peculiar to a few of them.
Filtering Options
There are three filters available for each data type, which can be enabled by checking the respective box and requires a threshold value to be written in the input field next to it. These three filters are summarized below:
Effect Size “<” : filters out all the components with an Effect Size value greater than the threshold selected
Effect Size “>” : filters out all the components with an Effect Size value smaller than the threshold selected
p-value “<” : filters out all the components with a p-value value greater than the threshold
Warning
Whenever a threshold field displays a red background, it means that the aforementioned threshold is not valid and contains a typing error. In this situation if the related filter checkbox remains enabled, the submit button will disappear until this error is either fixed by changing the threshold value or by disabling the filter.
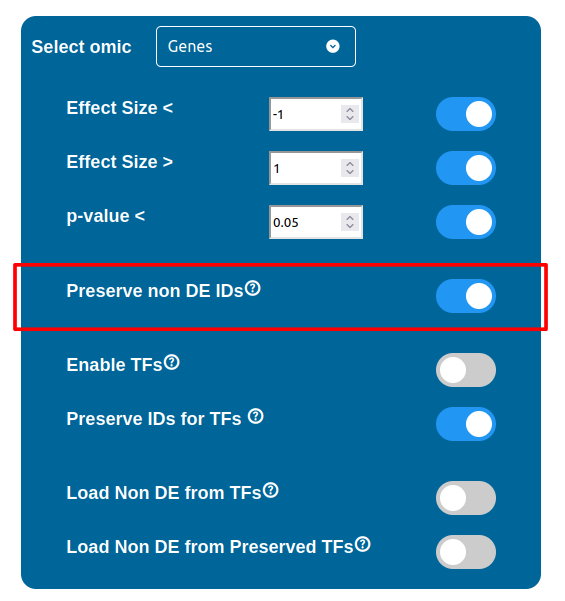
ID Preservation
ID Preservation can be enabled for every data type by checking the “Preserve non DE IDs” checkbox. This feature will not let PathLay to discard IDs found in the dataset without an Effect Size value. These “ID Only” components will be represented with a different palette of colors since they do not provide any information regarding their differential expression, but they will be still integrated with the other datasets.
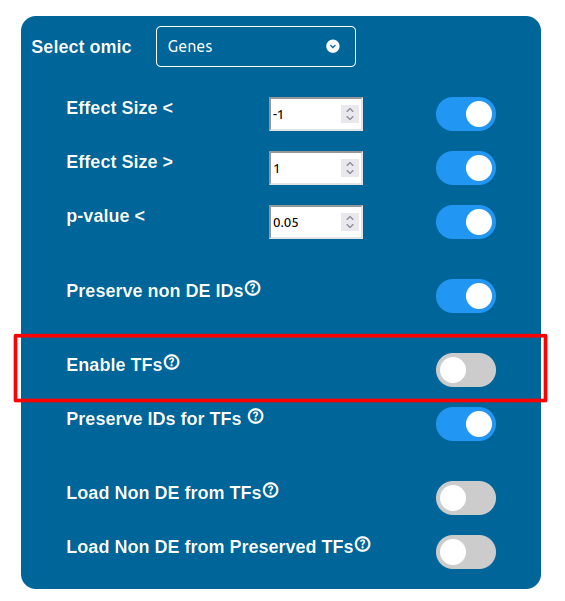
Transcription Factors
PathLay also supports GTRD as a database and can display transcription factors (TFs) that interacts with genes coming from a Transcriptomic or Proteomic dataset and as well recognize if those gene/protein IDs actually refers directly to a transcription factor. Transcription factors will be loaded and linked to the gene IDs in the Transcriptomic dataset if the “Enable TFs” feature is enabled. The same goes for the proteomic dataset which has its own “Enable TFs” feature. If a transcription factor is found in the Transcriptomic dataset it will be linked to any related gene also present in the dataset. Whenever Transcriptomic and Proteomic datasets are enabled together and the “Enable TFs” feature is enabled for at least one of them, once a TF is recognized, its targets will be looked for both in the Transcriptomic and Proteomic dataset to guarantee an high level degree of integration.
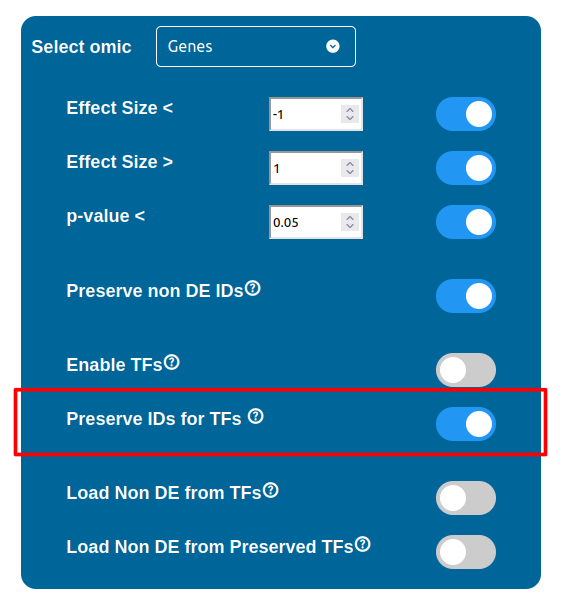
Normally, if a Transcription Factor is recognized in an ID Only component found in the Transcriptomic or Proteomic dataset (when of course the “Preserve non DE IDs” feature is enabled for them), it is just loaded as a DE component and not represented as a TF. To overcome this, one should enable the “Preserve IDs for TFs” feature in the Gene or Protein configuration depending on the scope of the analysis. Transcription Factors recognized in this manner will be represented as small oragne squares on the right side of the main indicators.
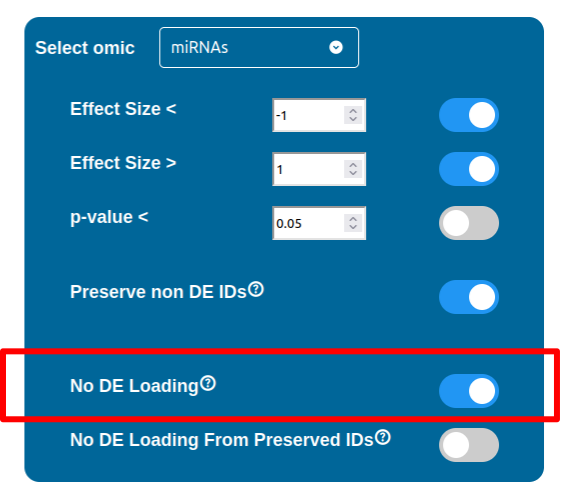
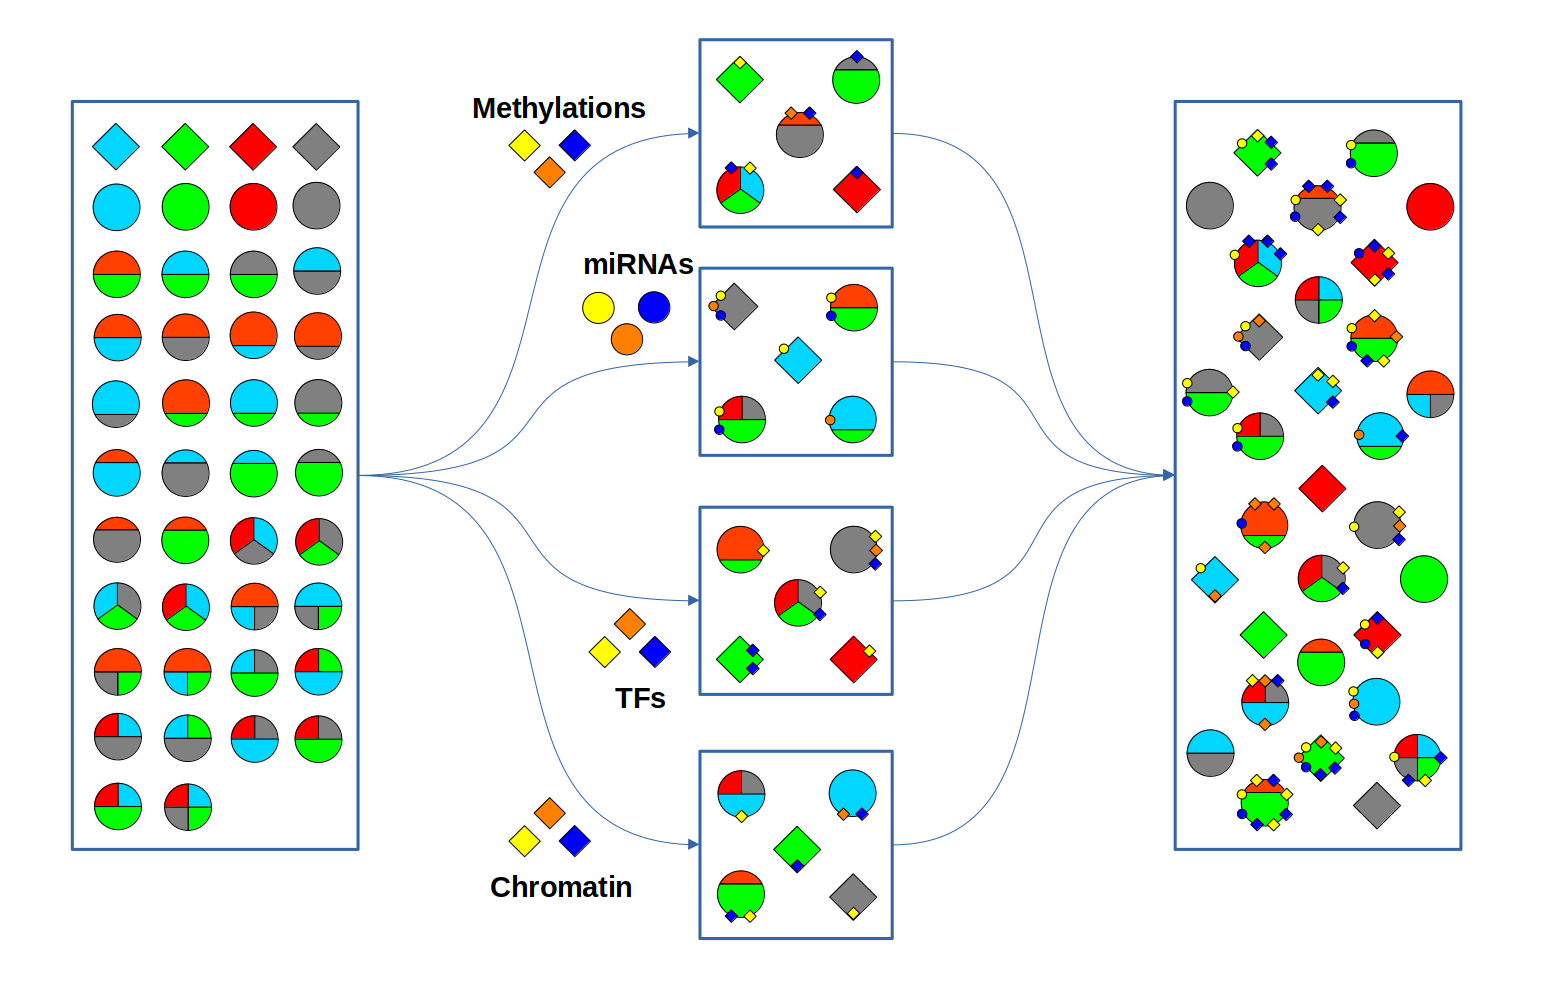
Non Differentially Expressed IDs
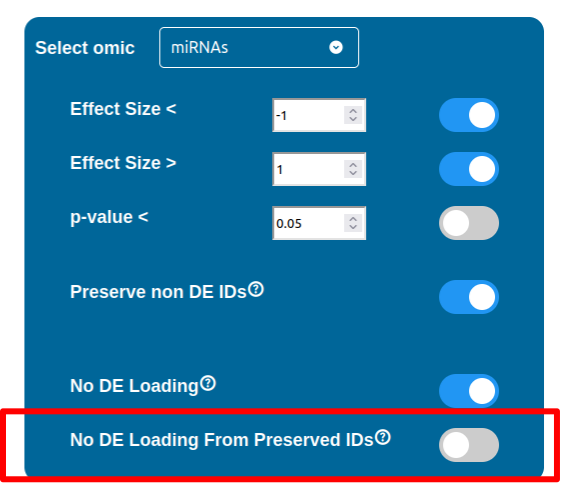
Whenever a miRNa, Methylation or Chromatin status dataset is enabled, miRNas, methylations and chromatin statuses will be represented alongside the related genes. PathLays’s approach is to integrate the information held within different datasets whenever is possible, hence when a Transcriptomic or Proteomic dataset is provided and enabled alongside the afromentioned ones, the standard procedure adopted is to represent an integration of these informations using genes and proteins provided as a scaffold on which miRNAs, methylations and chromatin statuses impact. Anyway It is possible to represent miRNas, methylations or chromatin statuses despite the absence of their related genes in the Transcriptomic dataset, by checking the “No DE Loading” feature in their respective configurations. This feature allows PathLay to display miRnas, methylations and chromatin statuses on grey indicators that represent a non-differentially expressed gene (i.e. a gene not provided in other datasets). This feature specifically works with the IDs of miRNAs, methylations and chromatin statuses linked to an Effect Size value, while the IDs without an Effect Size value will be only linked and represented alongside those genes or proteins that are effectively provided by their respectiv datasets, unless the “No DE Loading From Preserved IDs” feature is enabled. By doing this, ID only components coming from these thre datasets will also be able to call out Non DE genes and proteins. Graphically speaking this is translated into grey indicators surrounded by smaller circles and squares coloured in orange.
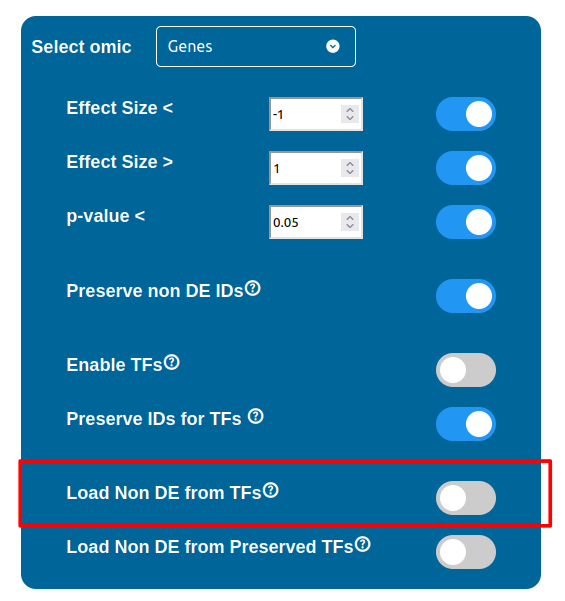
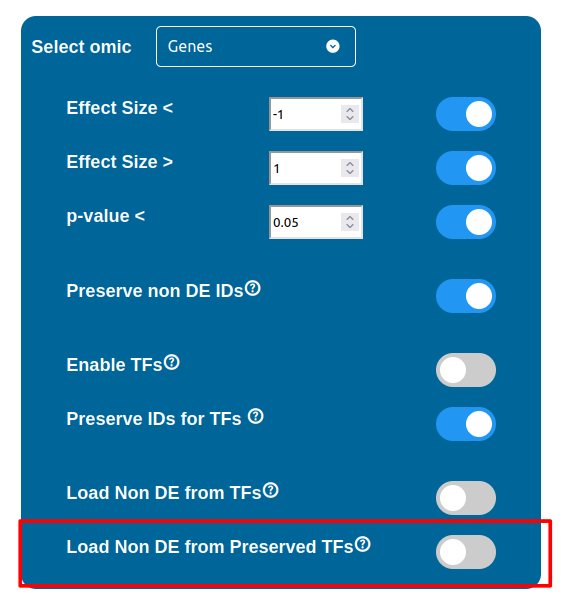
The “Load Non DE from TFs” feature provides the possibility to let any differentially expressed TF found to be linked to genes and proteins not provided in the datasets, in a similar fashion of the “No DE Loading” feature seen in the miRNAs, Methylations and Chromatin Statuses configurations. As previously explained, ID only components will not be allowed to call out for Non Differentially Expressed Genes or Proteins unless this feature is manually enabled and TFs make no exception in this regard: enabling the “Load Non DE from Preserved TFs” feature will do the job.
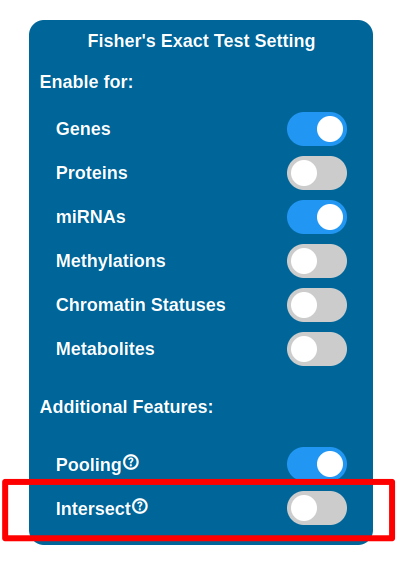
Maps Restriction Procedure
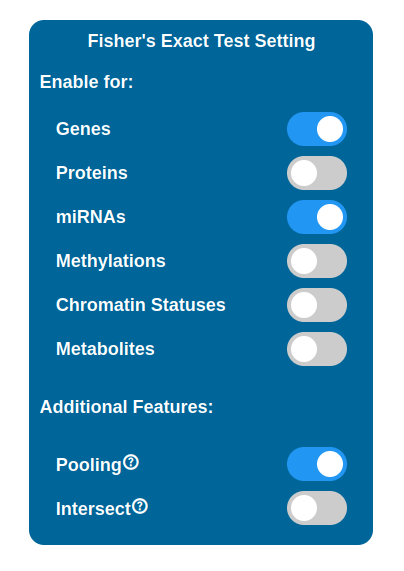
It is possible to perform a selection of maps to display in the PathLay - MAPS page by enabling Fisher’s Exact Test for desired datasets. Maps are selected with a statistical approach based on the Fisher’s Exact Test and since PathLay integrates different datasets, it is also possible to select which dataset will contribute on the map selection. By default the test is performed on each dataset enabled and it will produce a list of maps considered of importance, all the lists produced are then joined into one. There are two tweaks available that can change the result of this step: the Intersect option and the Pooling option.
Warning
To perform the test you need to provide a dataset that holds a p-value column.
Pooling
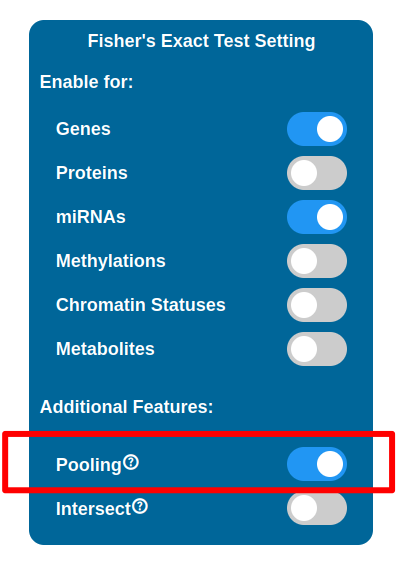
Eabling the Pooling option will affect how the Transcriptomic, Proteomic, miRNomic, Methylomic and Cromatin Status datasets are treated when enabled for the test. When enabled, the IDs of the above datasets will be merged and the test is performed on that single list.
Intersect
Enabling the Intersect option will affect which maps will be selected after the test has been performed. By default map lists are joined into one, meaning that even if a map has been found relevant in relation to just one of the datasets, it will be kept and indicators will be plotted on it. With the Intersect feature enabled, only maps that are considered relevant for all the datasets enabled are kept (i.e. the ones that appear in every map list coming from the tests performed).
Pathway Explorer
The “PathLay - MAPS” page will be displayed after the configuration and the submitting of an analysis on an Experiment Package in your home. IDs coming from your datasets will be portrayed as different indicators on pathways depending on the Analysis Mode chosen (see more “Selecting an Analysis Mode”). This page allows you to:
Display your datasets on pathways
Filter pathways by selecting a specific gene/protein/miRNA/TF ID or by multiple IDs
Select a cellular compartment and display only the IDs localized in it
Select indicators and display their infos on the clipboard
Save indicators of interest and download them as a tab-separated text file
Filter pathways by selecting an “Agreement” between Gene/Proteins and Methylation, miRNAs or TFs
Warning
The “PathLay - MAPS” page is directly accessible after you hit the “Submit” button allowing you to navigate through pathways right away but depending on how much data PathLay needs to process, some indicators may not be displayed correctly from the go and require more time.
Pathways available are listed in alphabetical order in the dropdown menu on the top left corner. The pathway name and ID are displayed and the numbers between round parenthesis give you information on how many indicators are loaded on the pathway. Selecting one pathway from this menu will instantly display it with its the indicators.
Note
The pathway selector will display all the pathways available only when no other selections have been performed. Whenever an ID/Agreement/Cellular compartment based selection is performed, this dropdown menu will provide only those pathways that satisfies the parameters of the selection. To return at the initial, default state, simply reset your selections.
Highlight: Provides the selectors to highlight indicators containing specific components
Screenshot: Creates a downloadable image of a map with its indicators
Clipboard: Open or close Clipboard
Settings: Allows tuning of indicators transparency and size
Selectors: Provides the main query system for pathway and indicator filtering
?: Displays helpful information regarding the interpratation of the indicators
These sections and the respective features will be explained in detail later.
In this sections two selectors are displayed and their content varies depending on the features enabled during configuration. The first selector lists the categories of components available between: Genes, Proteins, TFs, miRNAs, Methylations, Chromatin Statuses and Metabolites. Selecting one data type will switch to the respective component selector filled with the available IDs. When an ID is chosen, all the indicators related to it will be highlighted with a pink dotted border, and the maps not containing any indicator of interest will be disabled from the map selector.
Note
To reset the highlight simply select the first option from the ID selector.
Note
The highlight feature will highlight only those indicators currently available from the displayable maps. This means that when a query from the “Selectors” section has been performed, the selectors in the Highlight section will be filled only with the components represented on the maps that remained available after it.
The Clipboard is a freely movable window that will be displayed as soon as the “Clipboard” writing is clicked in the menu. It is composed by two boxes, the “Info” box and the “Selected” box. The “Info” box will display the information related to a clicked indicator, this includes every ID that the indicator is portaying, with their differential expression values and other IDs eventually linked. Cliking on the IDs in the “Info” box will open up a page in the online database of reference for that data type:
NCBI for genes
UniProtKB for proteins
Mirtarbase for miRNAs
gsea-msigdb for TFs.
Once you have clicked an indicator on a pathway and its information is displayed on the Clipboard, you can click the “Add” button below the “Info” box and save the indicator inside the Clipboard’s “Selected” box. It will be listed as a smaller indicator under the name of the pathway from where the selction has been performed. Selecting this smaller indicator in the box will also display its information in the “Info” box and if the “Remove” button is clicked, the indicator will be removed from the “Selected” box. The “Select” button under the “Selected” box on the Clipboard performs the same operations as the highlight button in the Highlight Section, thus applying a dotted magenta border on the indicators of interest and disabling maps not containing them in the map selector. The last feature provided by the Clipboard is the “Download” button which allows to download a tab separated text document listing all the information regarding selected indicators currently populating the “Selected” box.
Note
Closing the Clipboard by clicking the “X” on the top right corner will not delete any selected indicator from the “Selected” box.
- This section contains the main query system of the “PathLay - MAPS” page allowing to perform a more sophisticate three level selection by:
IDs
Agreement between two components
Ontology (Cellular Compartments)
These selections can be performed by adding a query tag using one of the three selectors and clicking the respective “Add” button. Once all the query tags you are interested in are added to the pool on the right, the query can be performed by clicking the “Select” button.
- A brief summary of the rationale behind the query is the following:
The IDs provided are rounded up and only those maps that contains indicators representing them are allowed to proceed in the query. Is important to note that this step works with an “AND” approach so, whenever a map does not represent even one of the IDs provided, it is discarded and thus removed from the selector.
The Agreements provided are rounded up and the indicators that are currently displayable or that passed the previous step of the query, are checked for all the Agreements. Whenever an agreement is not satisfied, the indicator is hidden and if all the indicators in a specific map don’t satisfy the agreements, the map is discarded and removed from the selector.
The Ontologies provided are rounded up and the indicators that are currently displayable or that passed the previous step of the query, are checked for components that refers to the cellular compartments selected. Whenever an indicator doesn’t refer to one of the compartments selected, it is hidden and if all the indicators in a specific map don’t refer to the cellular compartments, the map is discarded and removed from the map selector.
To reset the interface to its default state simply click the “Reset” button next to it. Details on each type of query tag are provided below.
Select by IDs
The first row in the Logical Section is composed by a selector that allows the selection of a data type between “Gene”, “Protein”, TFs, “miRNA”, “Methylation”, “Chromatin” and “Metabolite”, depending on your analysis configuration. Selecting one data type will pop up another selector with a list of IDs of the data type chosen, in a similar fashion of the HighLight section. Once an ID is selected, it can be added to the query pool “IDs Selected”. Every ID added to the pool will be represented as a query tag and can be removed from the pool by clicking the “X” button on the right. IDs’ query tag have colors are assigned considering the data type:
Light blue for genes
Purple for proteins
Red for miRNAs
Yellow for Metabolites
Grey for TFs, Methylations and Chromatin Statuses
The “Select” button will perform a pathway selection using the pool content as criteria: considering a strictly ID based query, only those pathways portraying all the IDs in the pool will be displayed in the pathway selector and kept available.
Warning
It is possible that loaded pathways cannot satisfy the requirements for the selection made. In this case the pathway selector will become empty. Resetting the selection with the “Reset” button will restore the pathway selector at its default state.
Select by Agreement
The second row in the Logical Section is composed by a series of selectors that allows the setup of the so called “Agreement” which is a feature that lets you select two related data types and select what type of correlation you are interested in. The main data type can be selected with the first selector which provides a choice between “Gene” and “Protein”, and the second data type can be selected with the other selector which allows a choice between “Gene” or “Protein” (depending on your main data type of choice), “miRNA”, “Methylation” or “TF”. After the two data types are selected, the last step to do is to choose a “Positive Agreement” or a “Negative Agreement” with the last selector and hit the “Add” button. The configured agreement will be displayed in the “Agreements Selected” pool positioned under the “IDs Selected” pool. Once the select button is clicked, indicators that don’t satisfy the requirements of the agreement will be hidden, thus if a pathway doesn’t have visible indicators it will not be included in the pathway selector. Multiple agreements can be added to the pool to make the selection more stringent. How various agreements work is reported in the following table:
As an example, let’s suppose we want to examine only the indicators including a gene and a miRNA in a positive agreement: it is only necessary to select “Gene”, “miRNA” and “Positive” from the selectors provided in the Logical section. A positive agreement between a gene and a miRNA is based on a negative correlation, so the indicators highlighted will either have an up-regulated gene and a down-regulated miRNA or a down-regulated gene and an up-regulated miRNA. As a next step, we could also be looking at methylations: easily enough, agreement selections can be stacked so we could also select “Gene”, “Methylation”, “Positive” and highlight only those indicators that satisfy both the agreements. As before, to remove it the “X” button on the right or the “Reset” button must be clicked.
Settings
The settings section in the “PathLay - MAPS” page will be displayed when clicking the “Show Settings” button and allows to change some graphical parameters for the indicators like size and transparency values.
Transparency and Size
Transparency and size of the indicators can be increased and decreased with the “Transparency Up”,”Size Up” and “Transparency Down”,”Size Down” buttons respectively.
Screenshot
It is possible to take a shot of the currently displayed pathway by clicking the “Open as image (to save..)” button.
Warning
Depending on your browser compatibility this feature can behave differently.
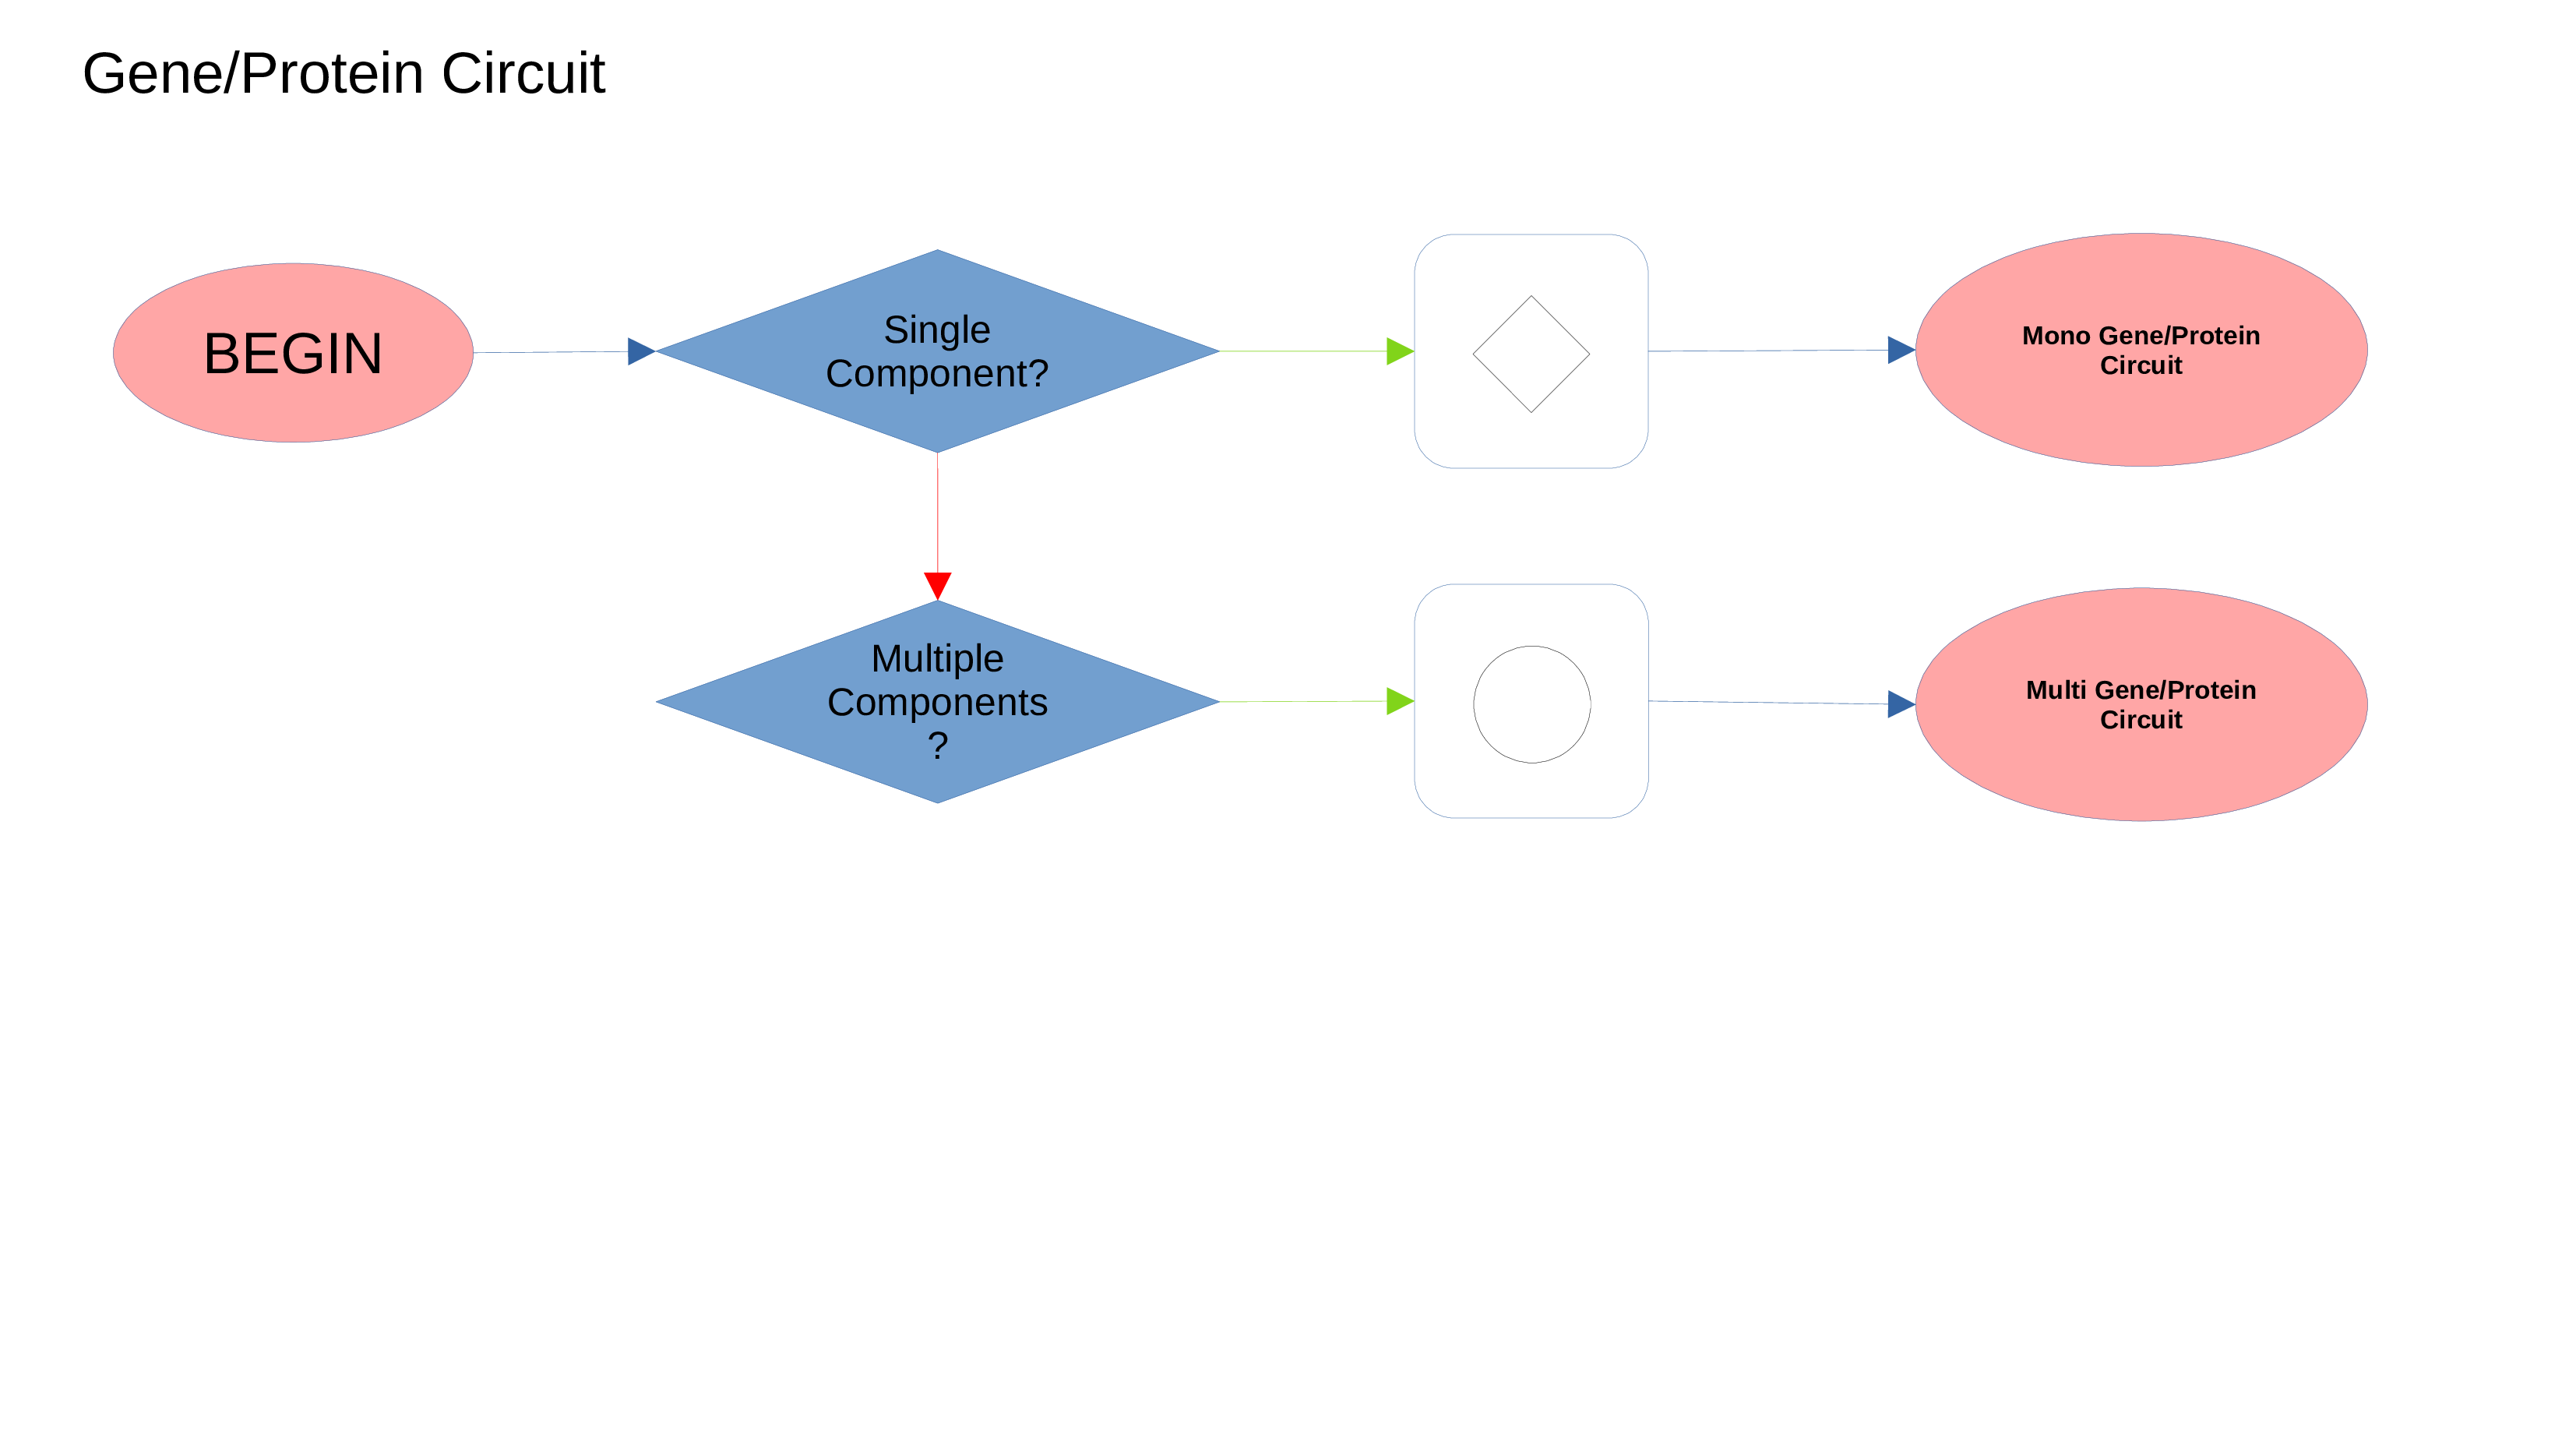
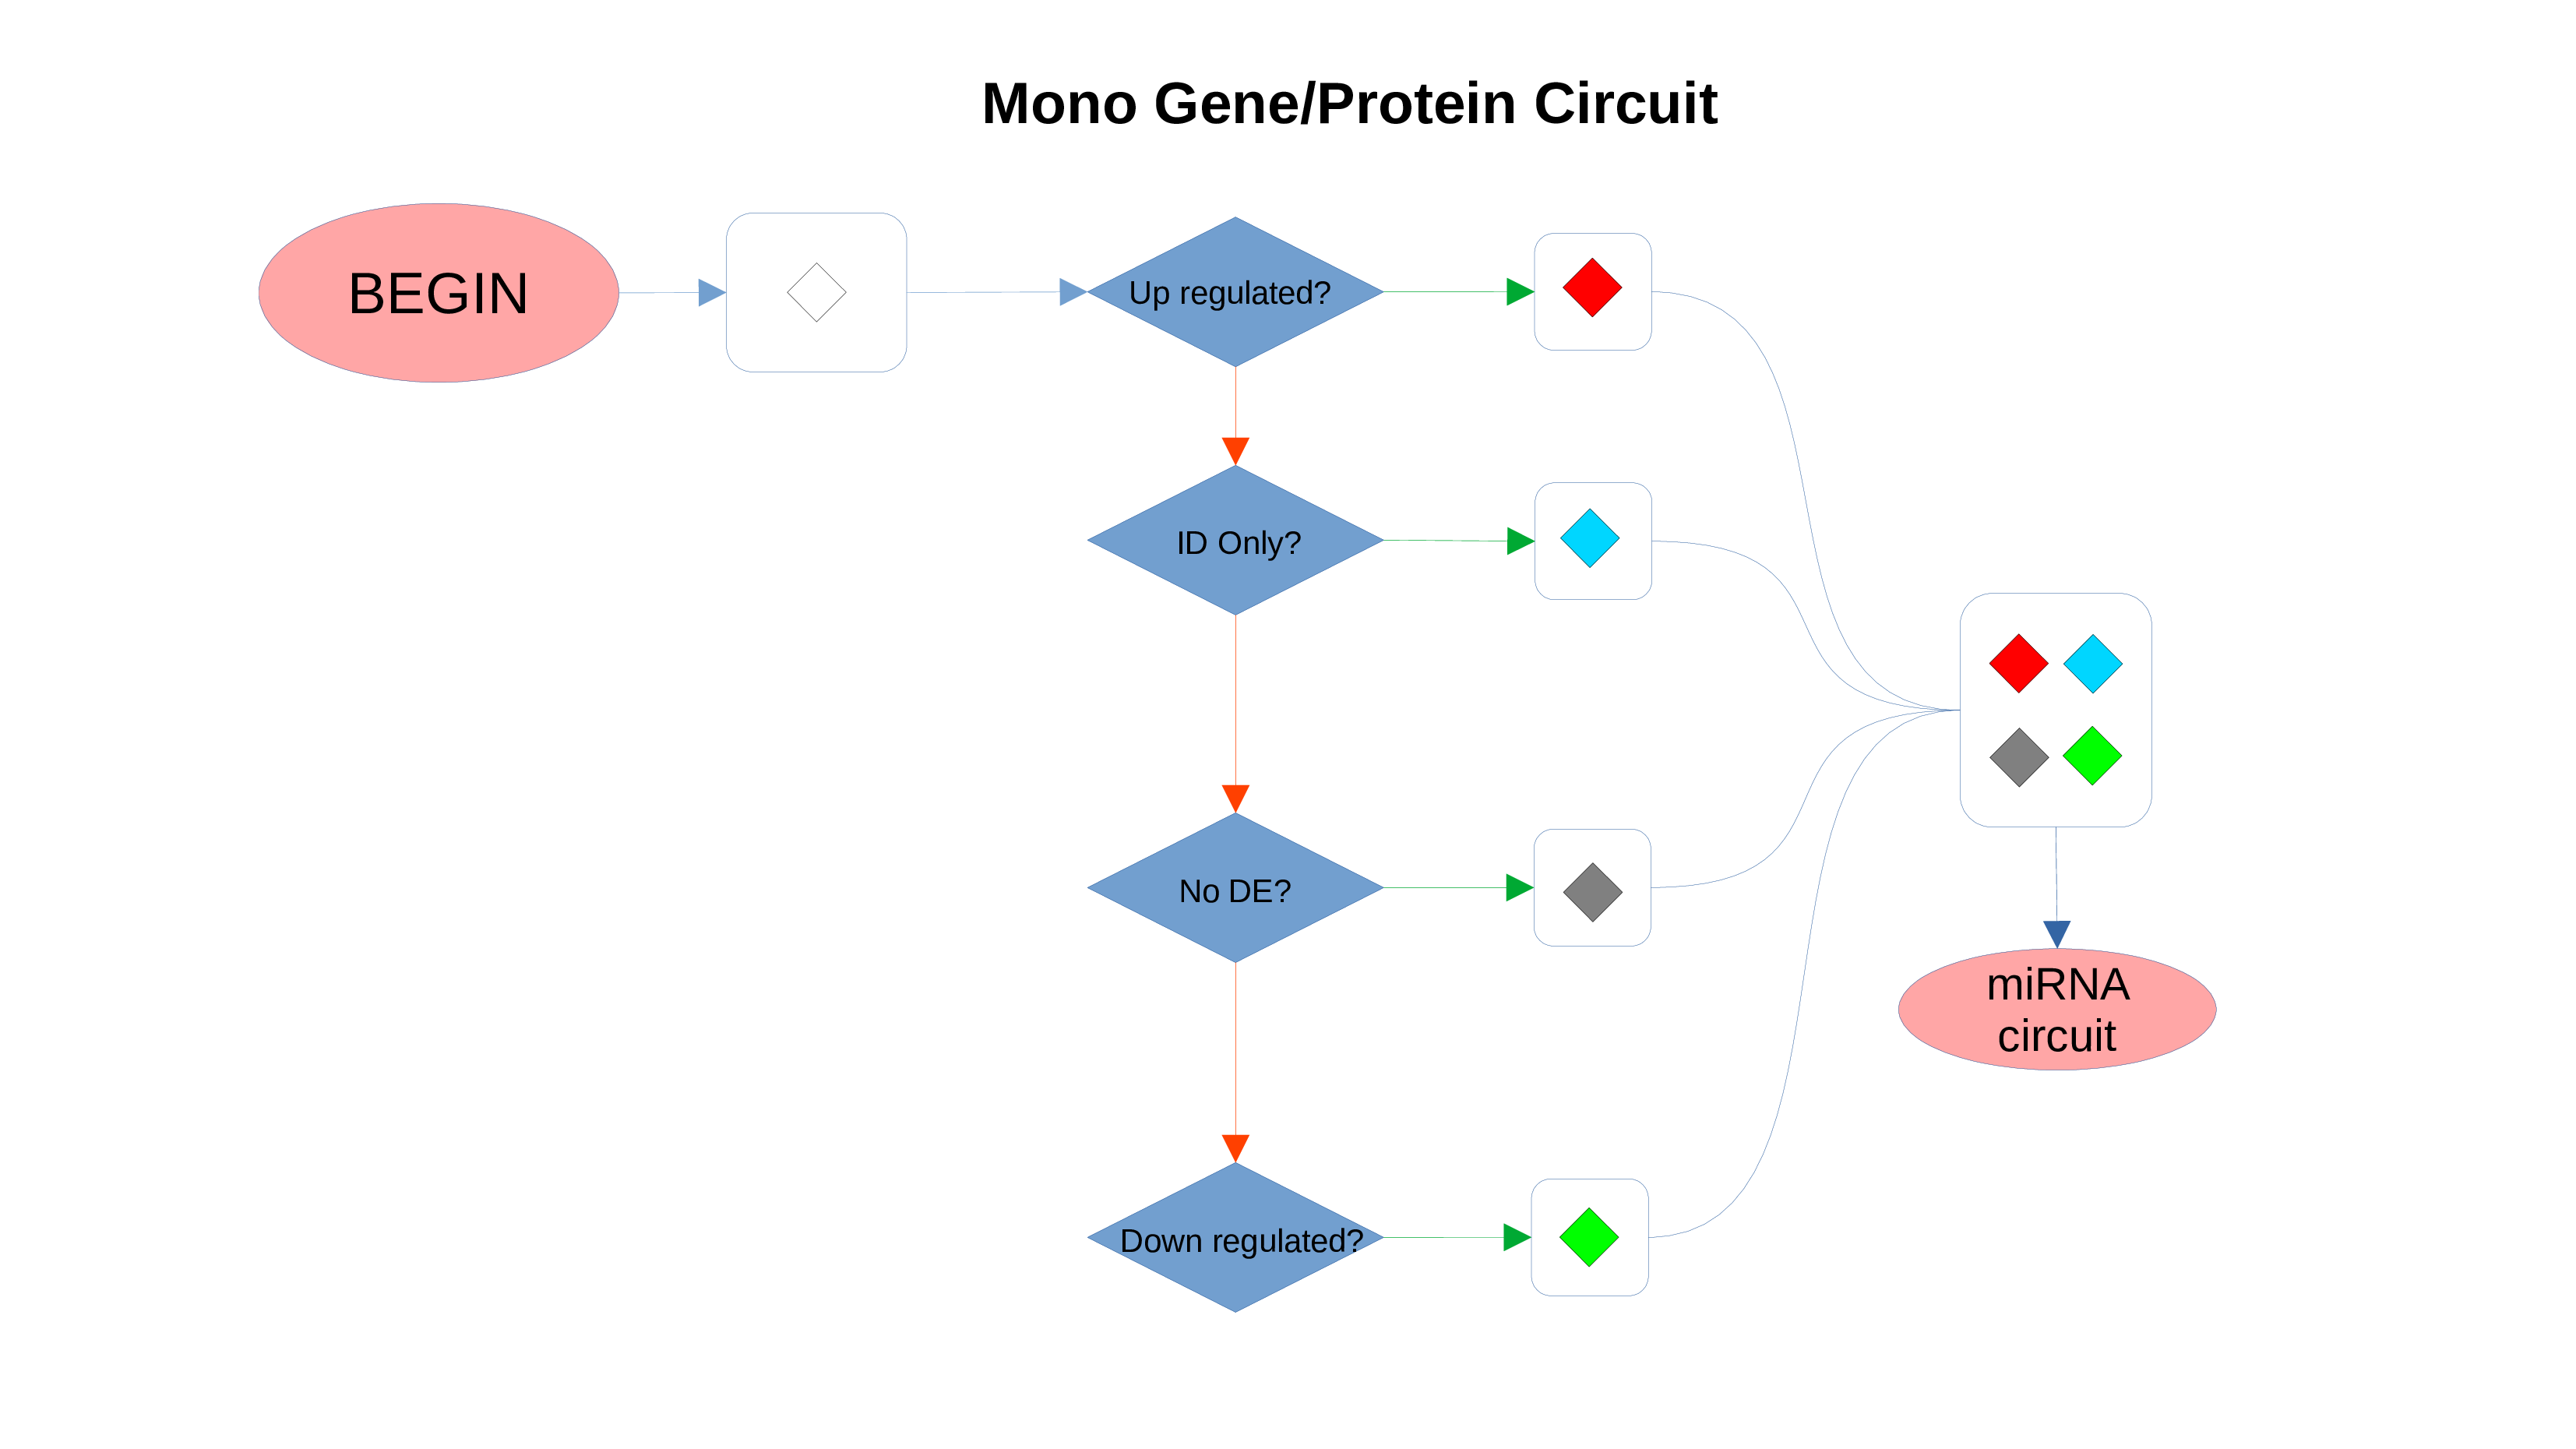
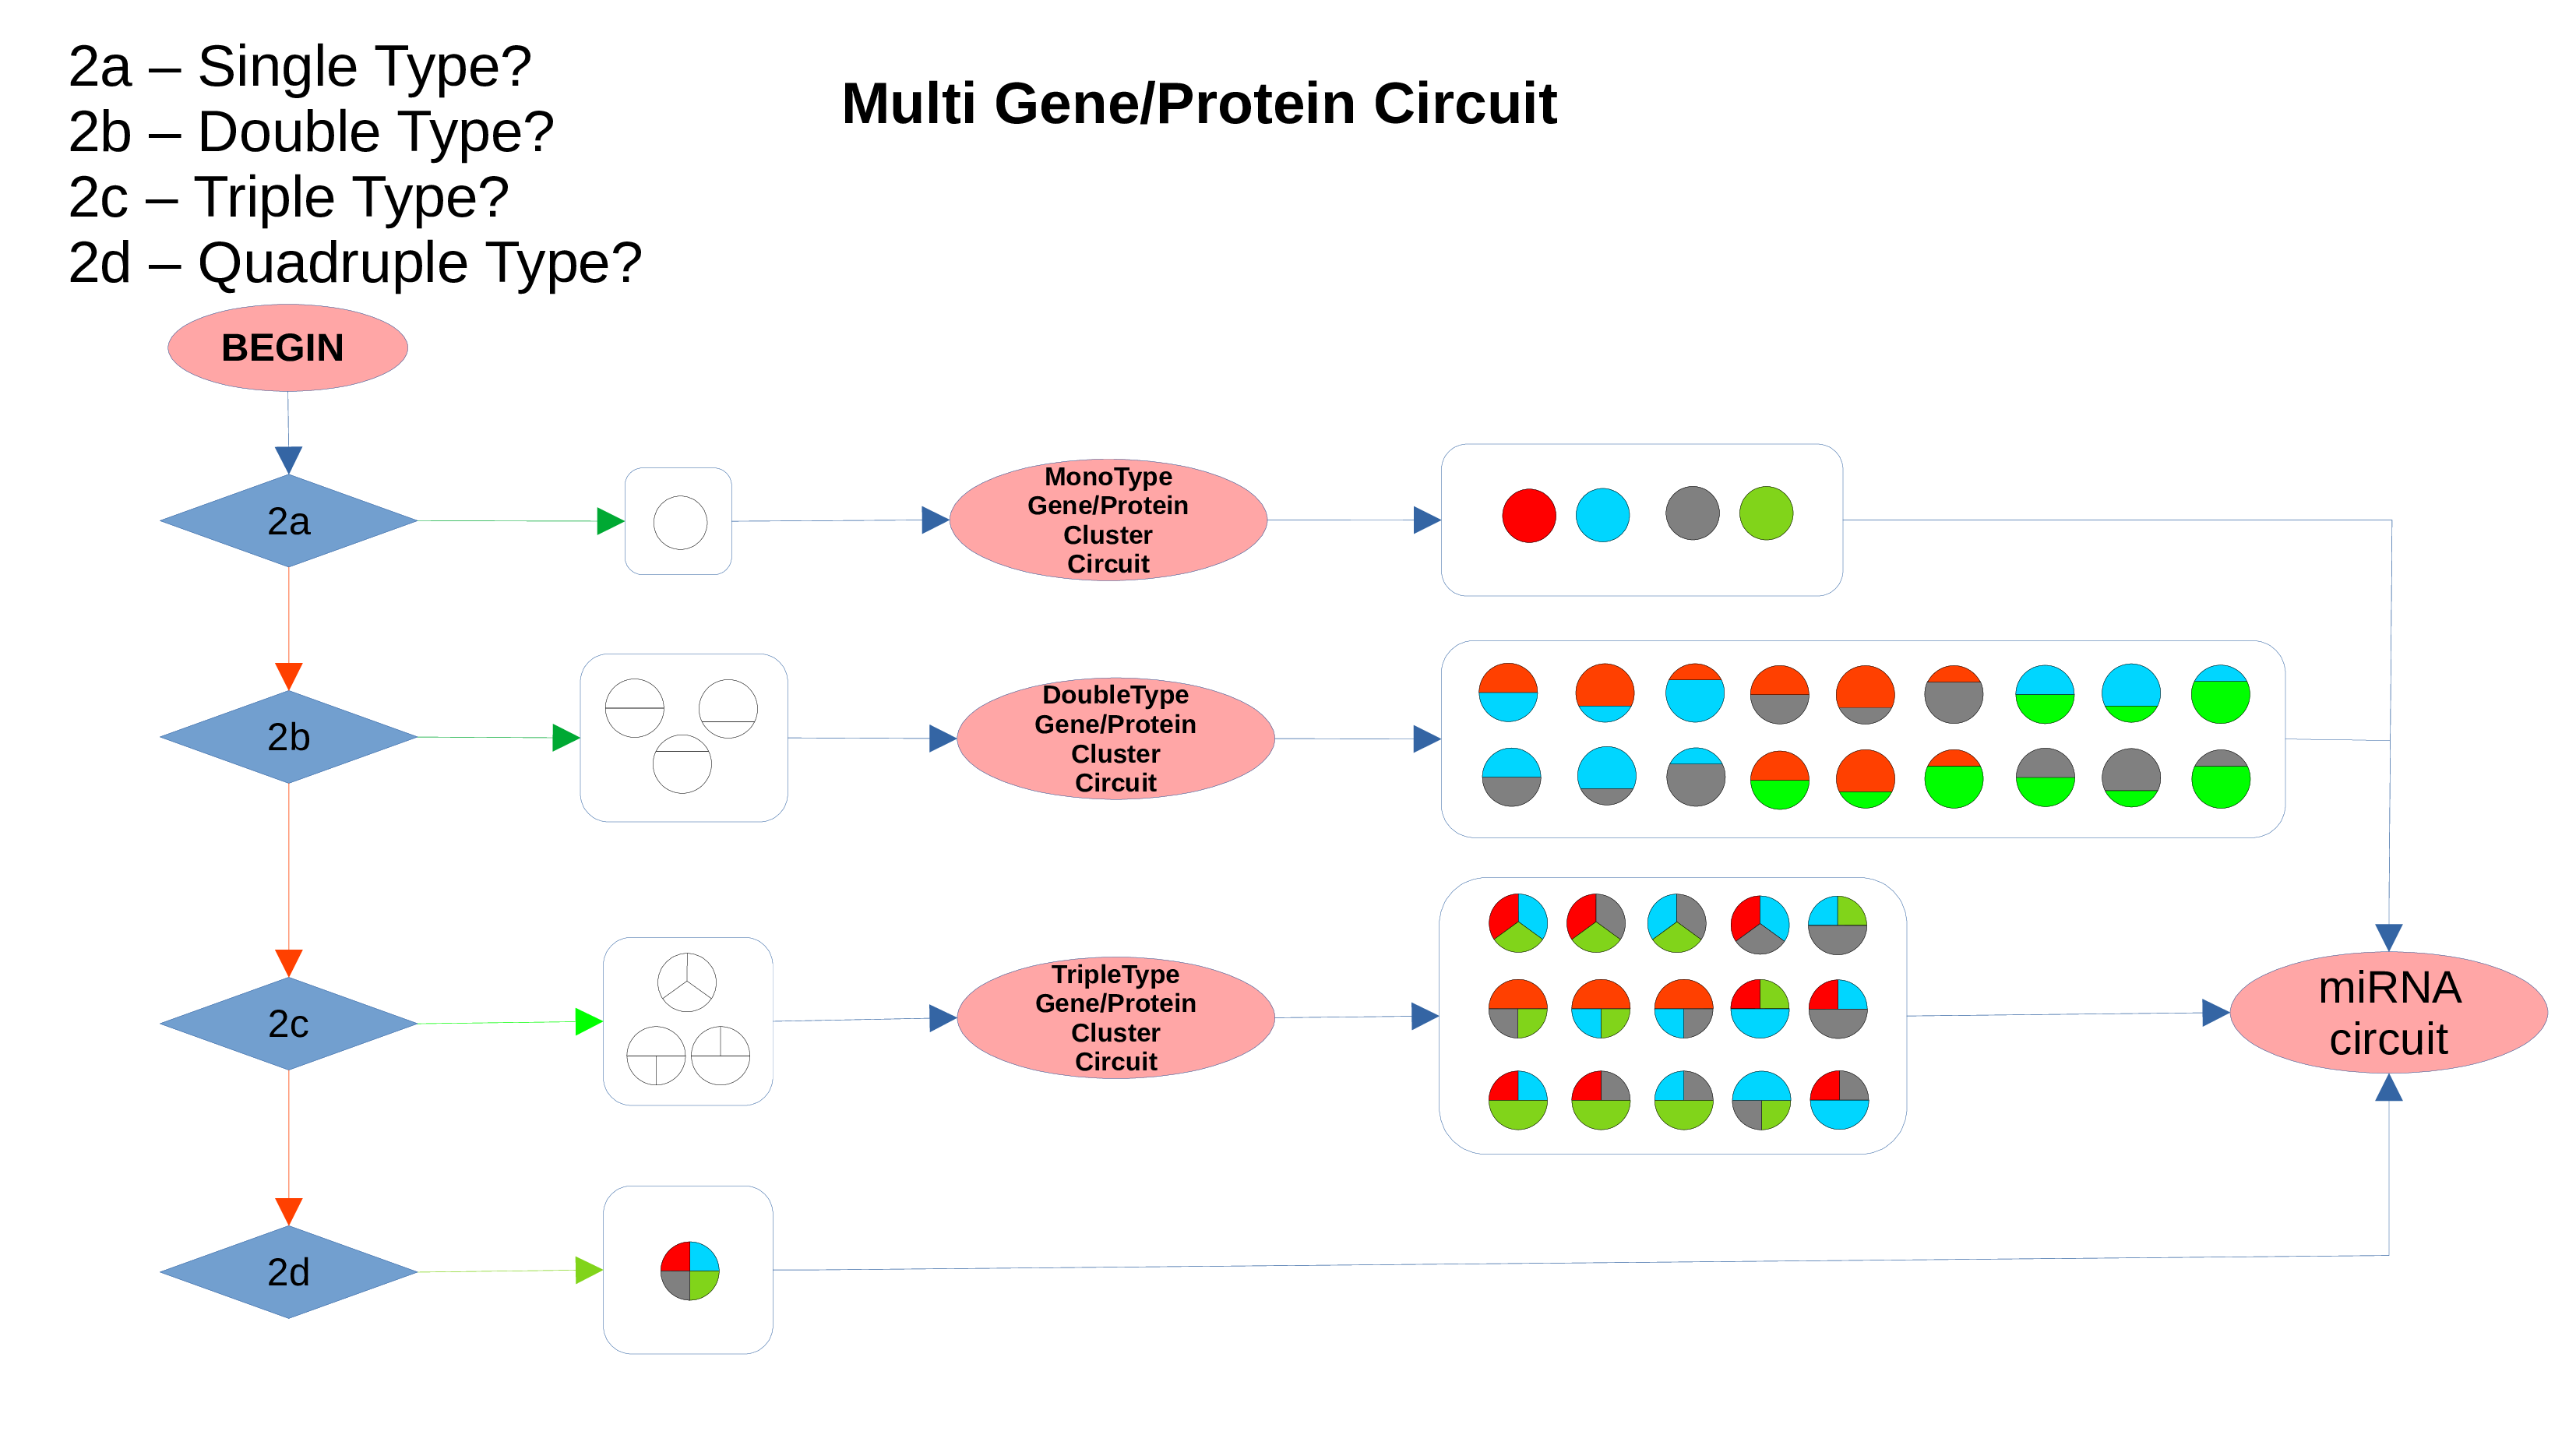
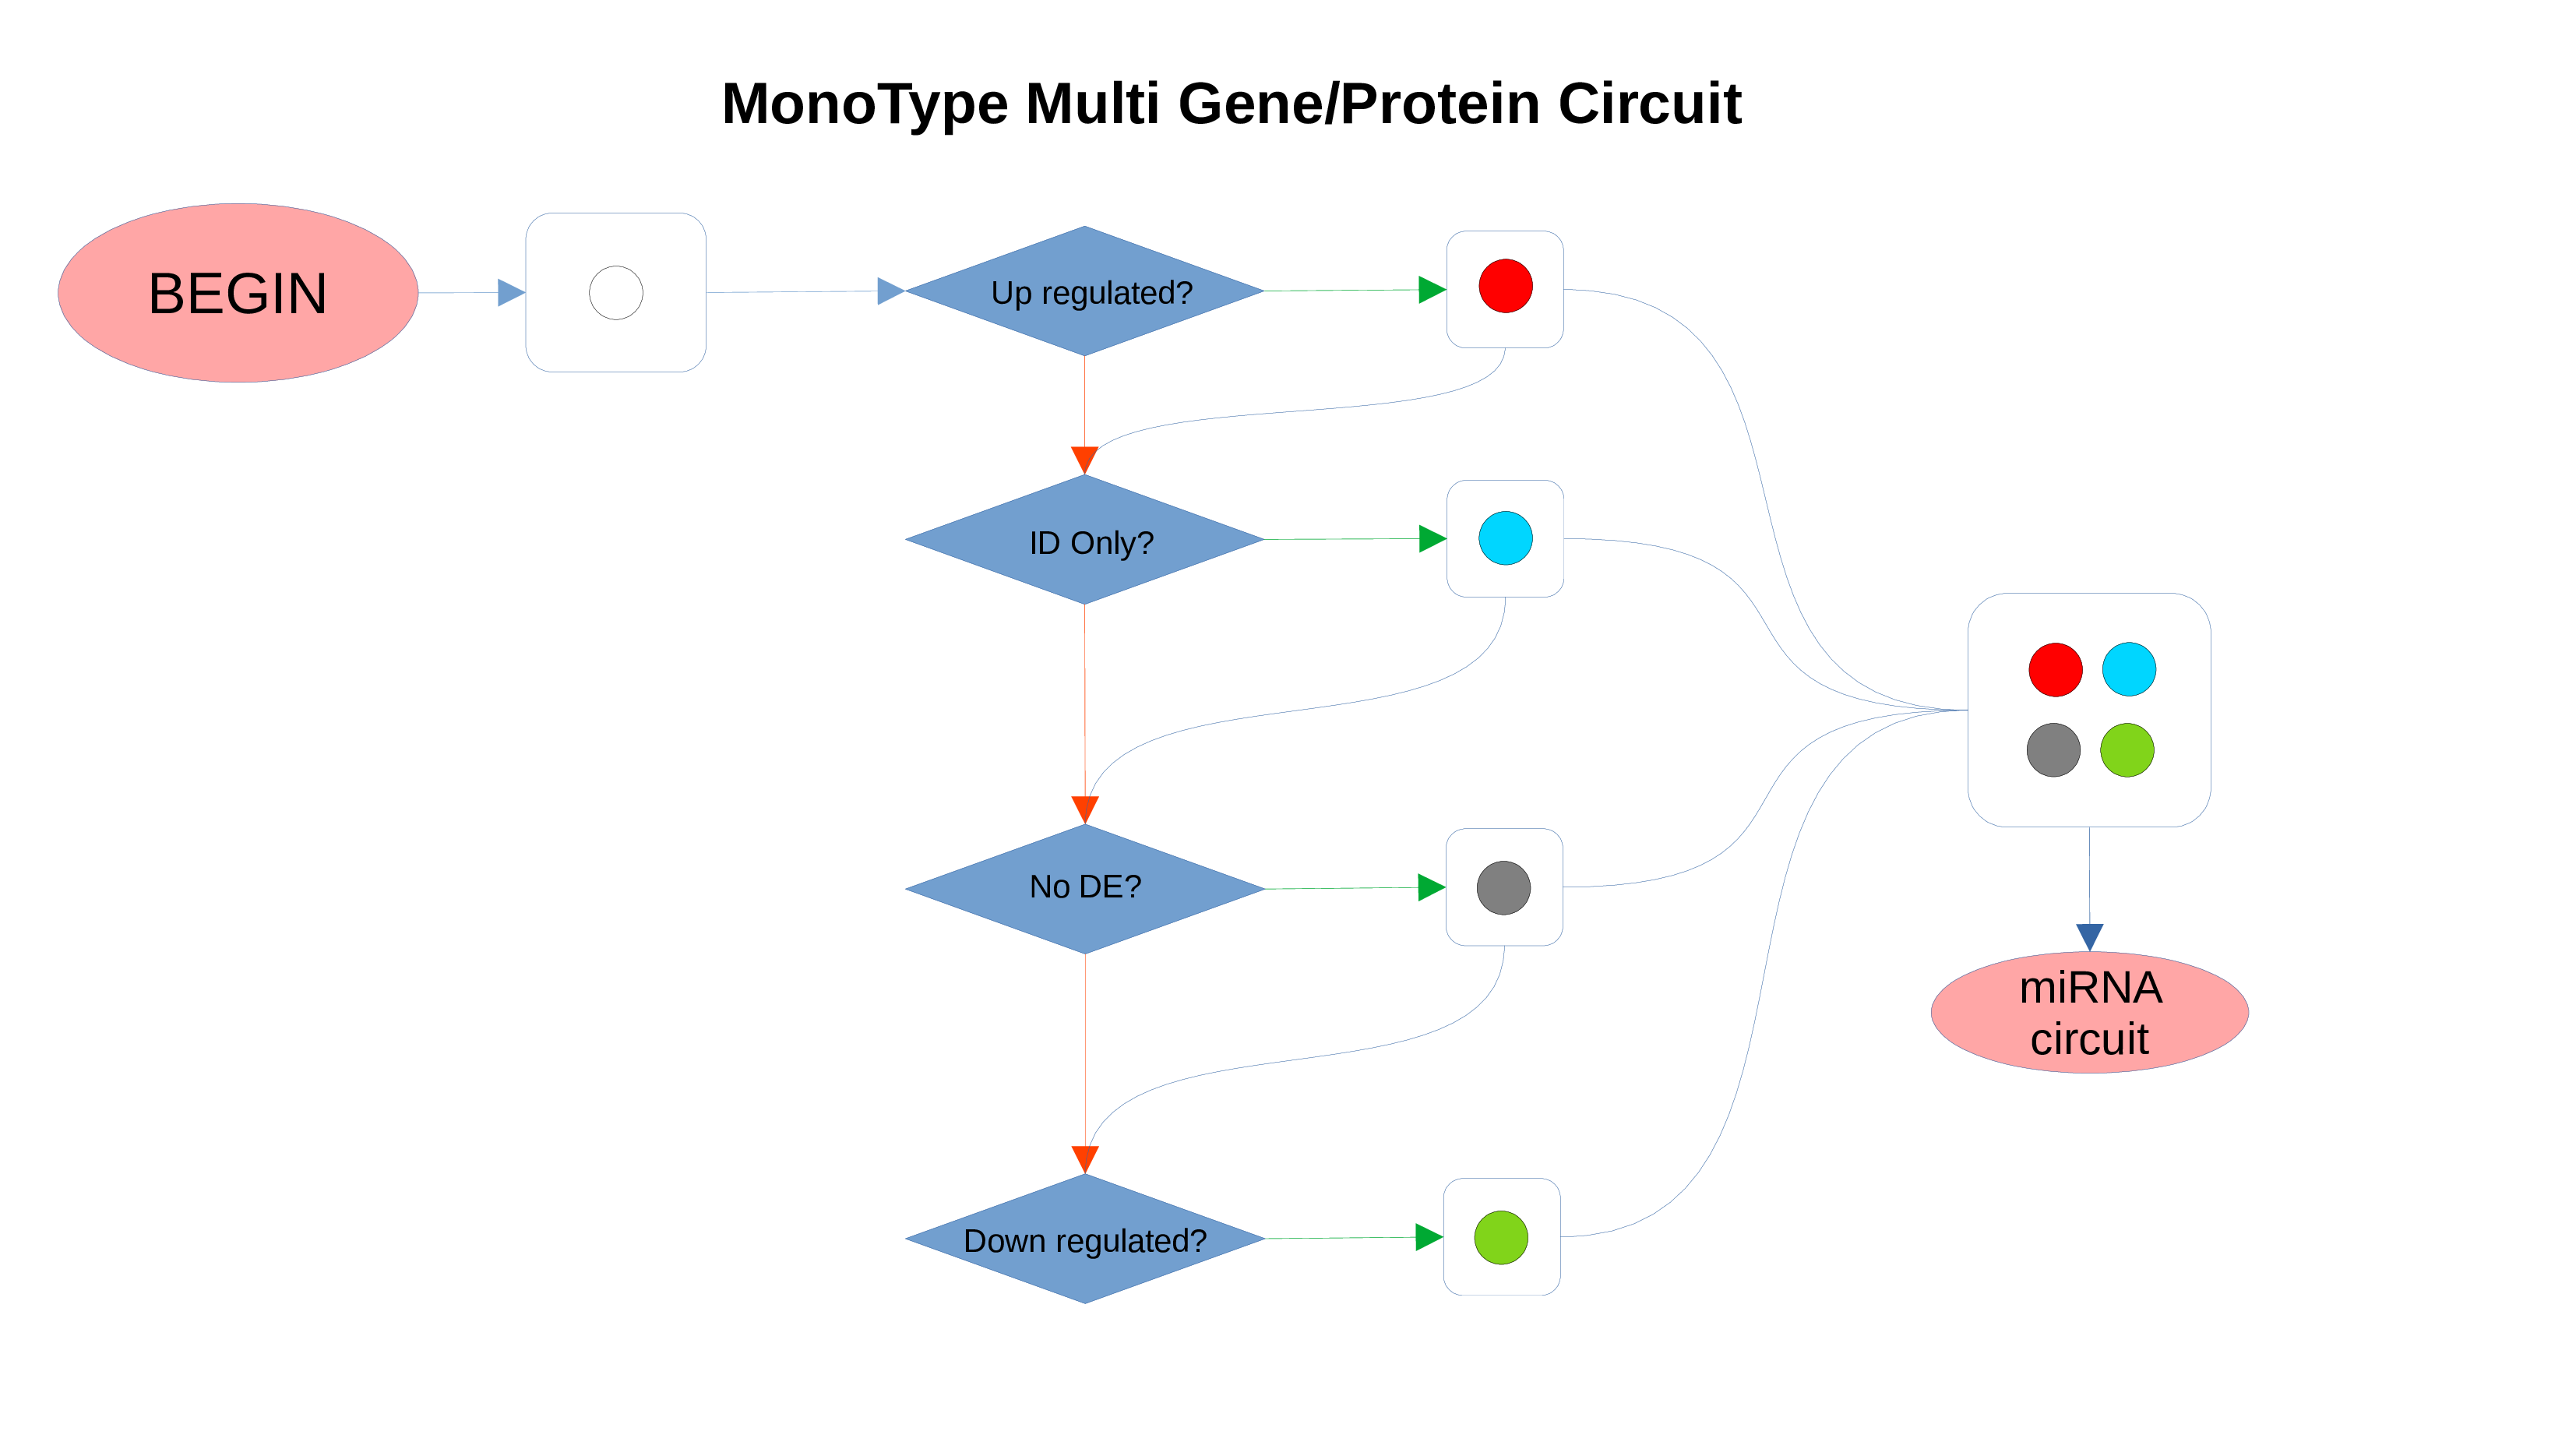
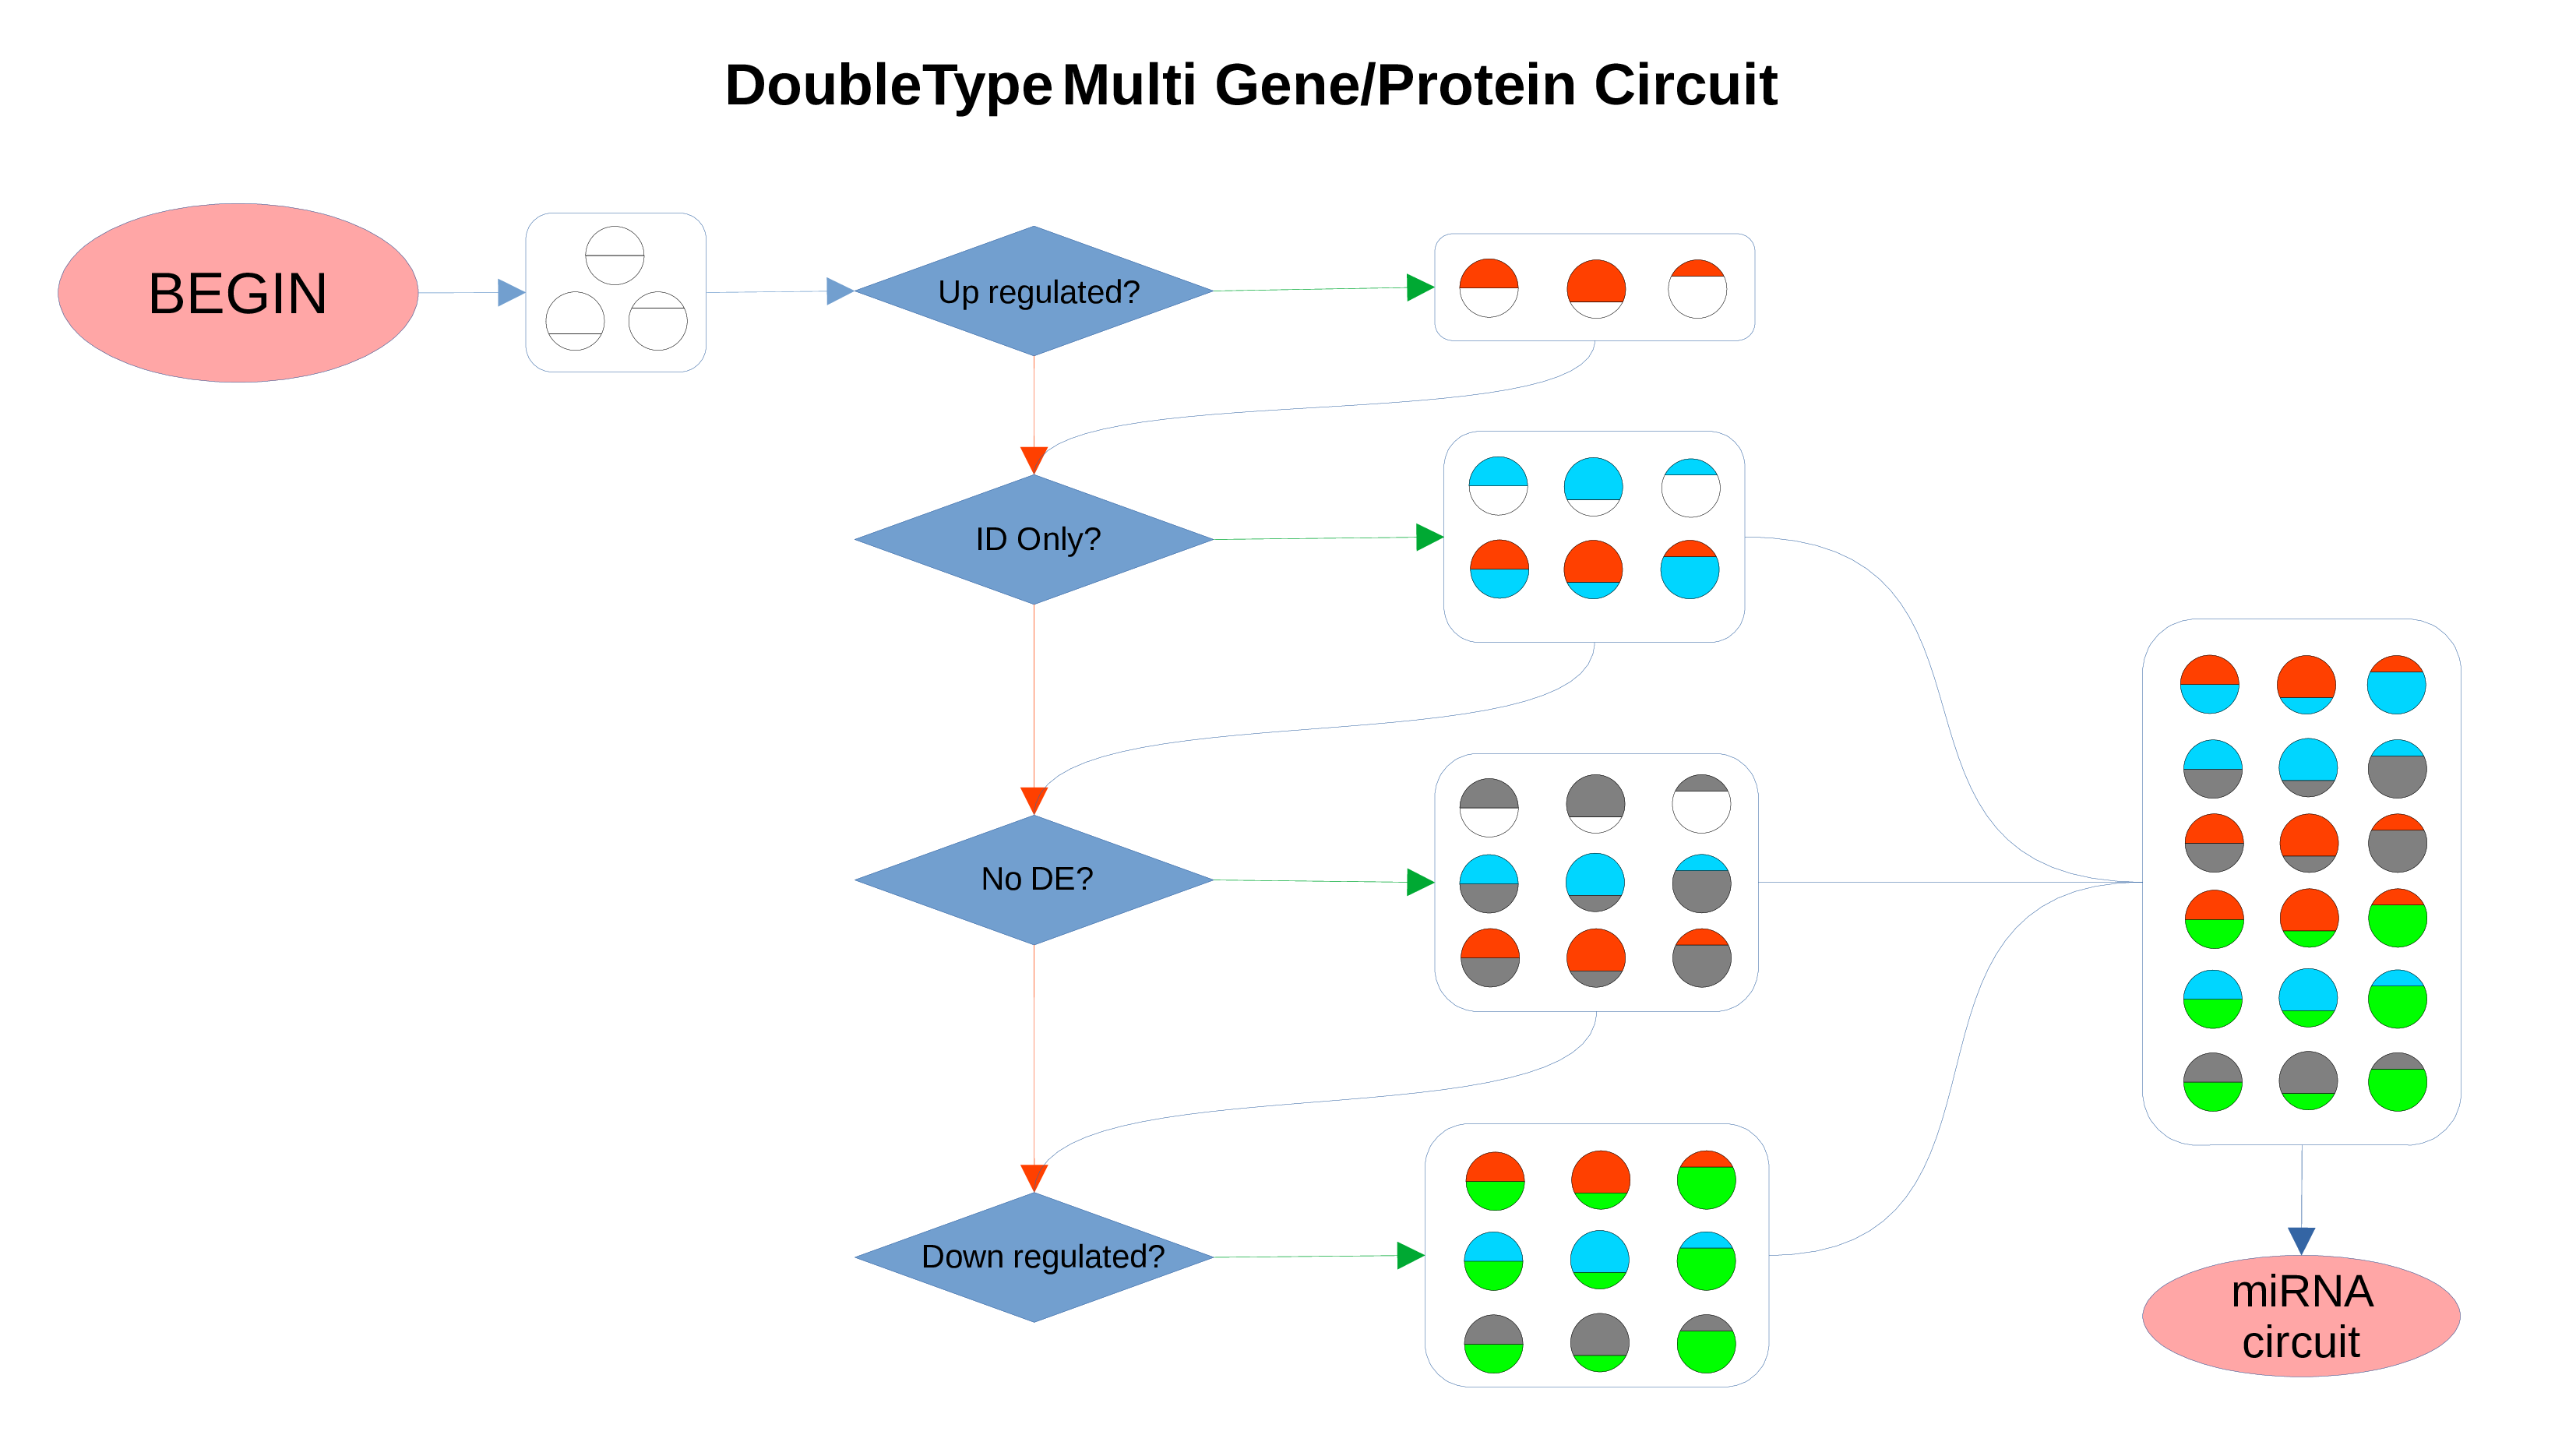
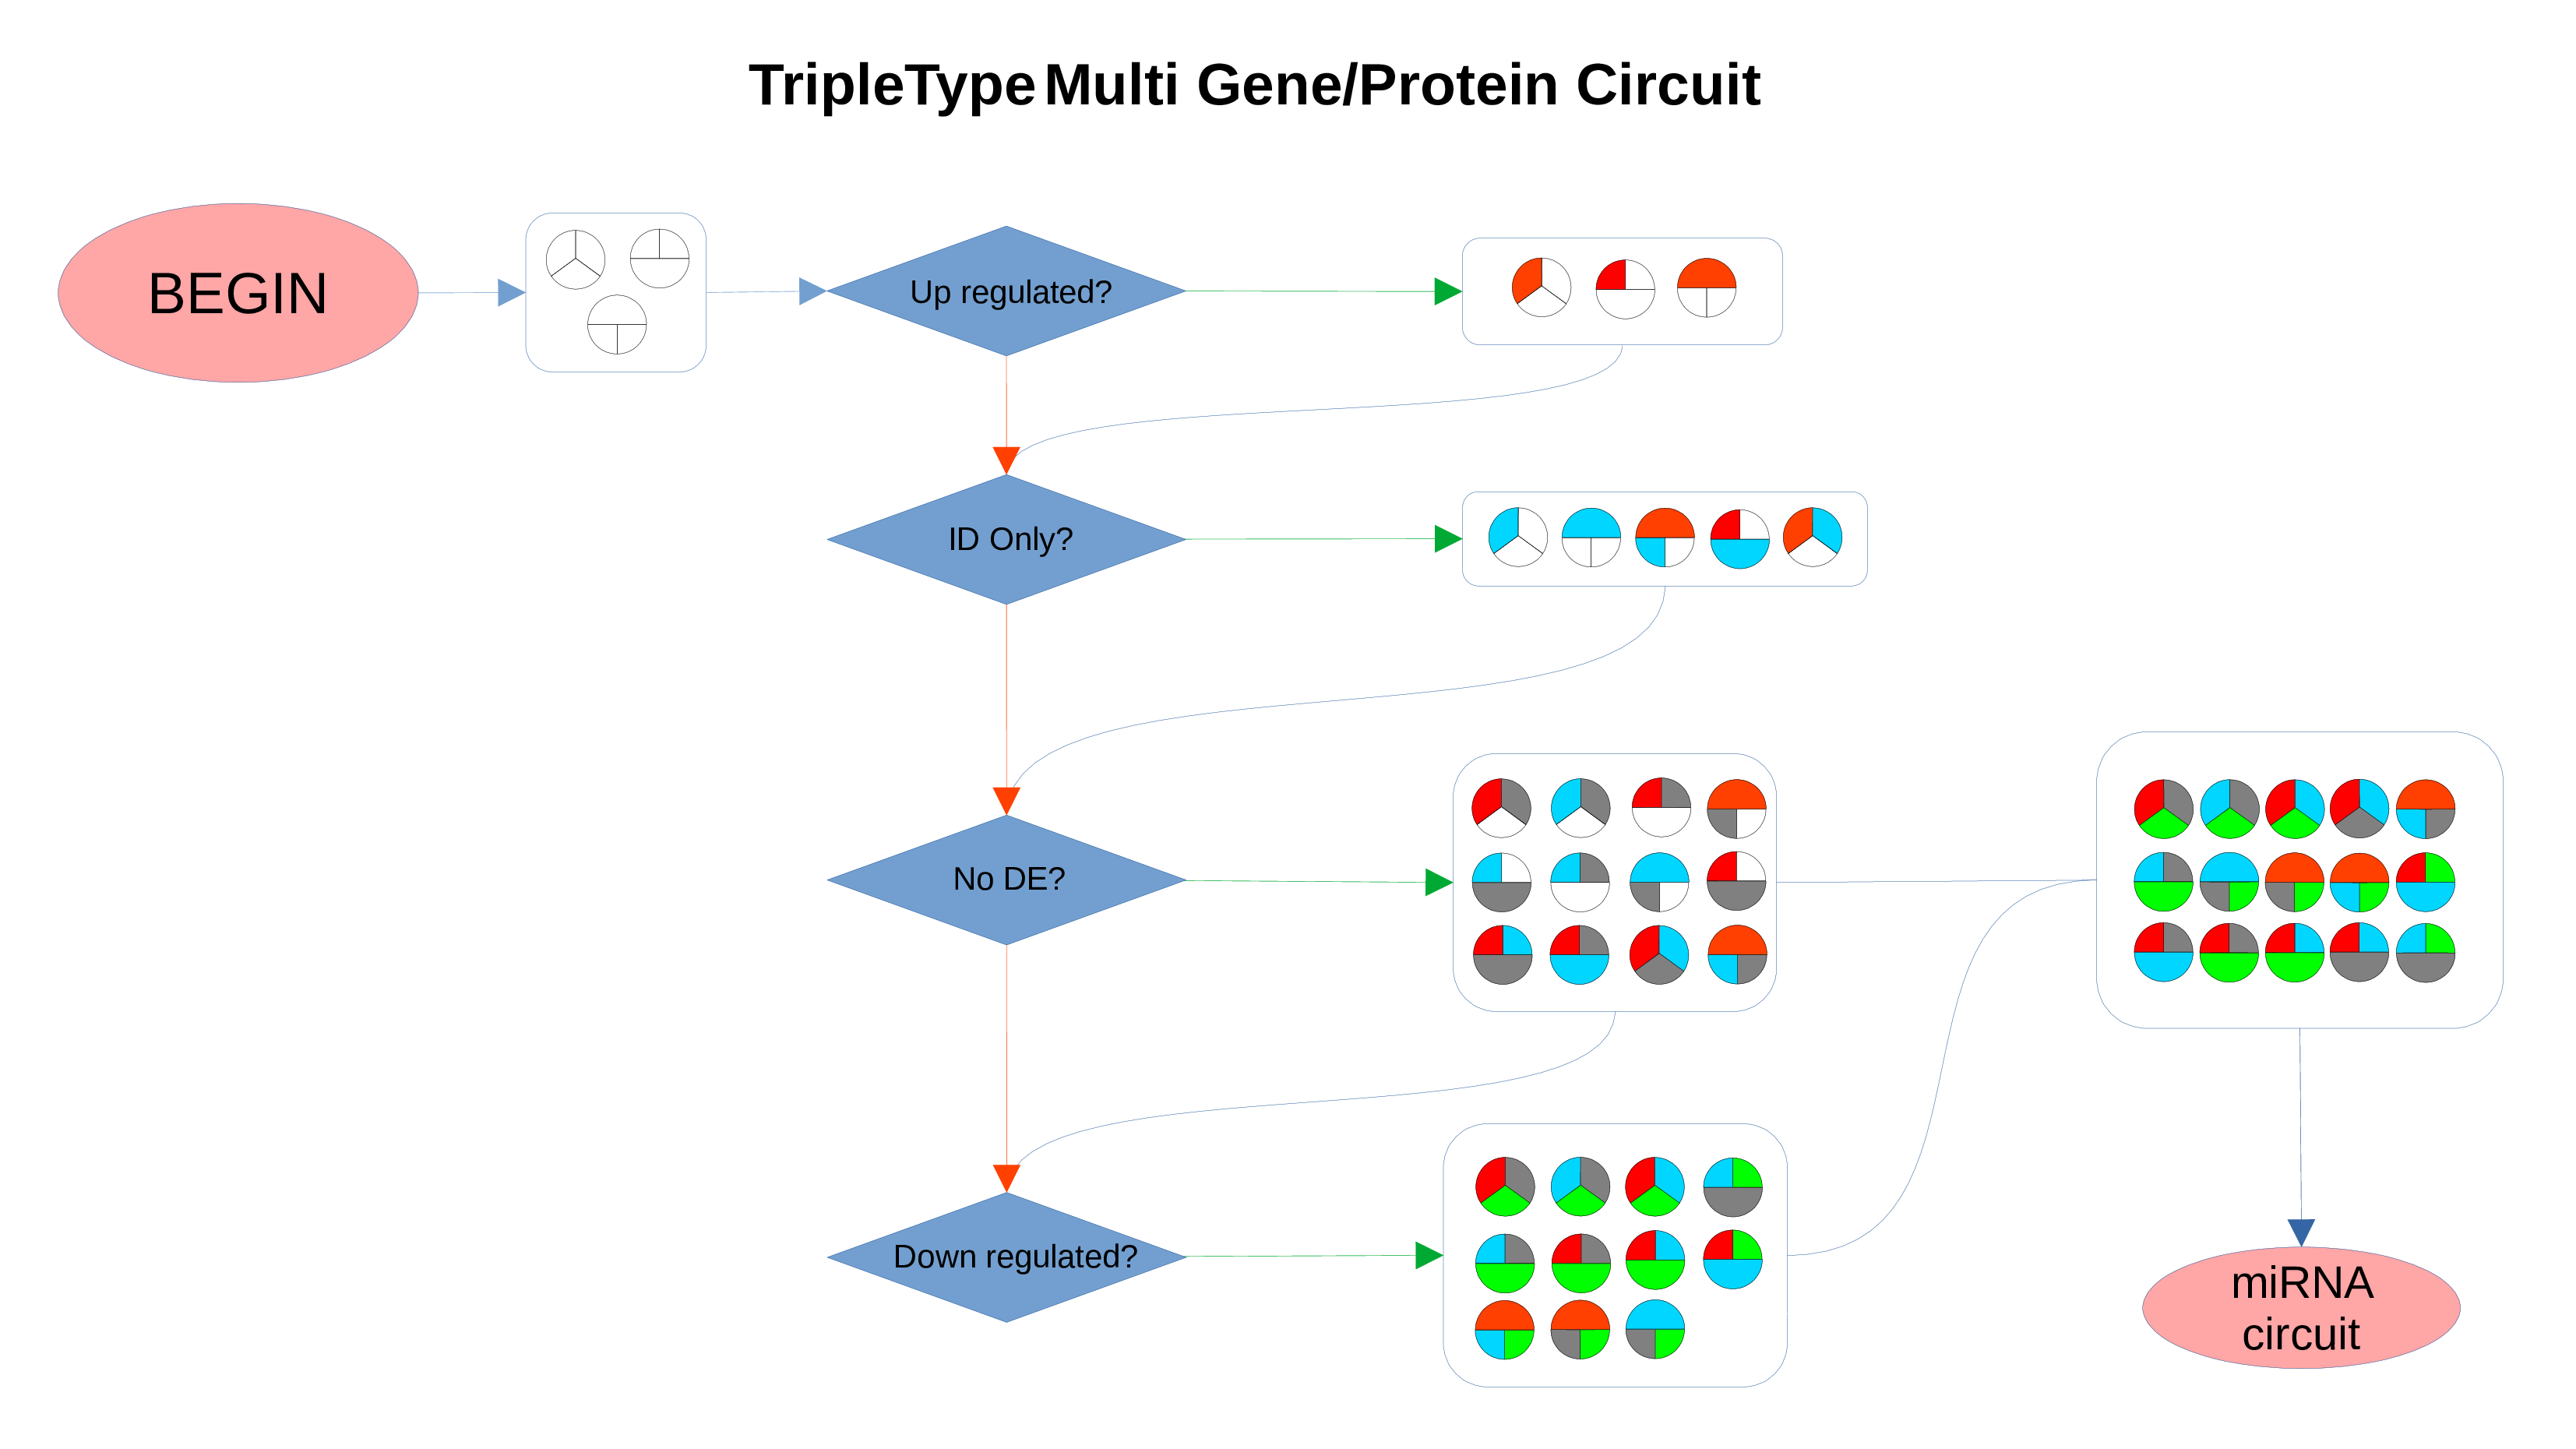
Indicators
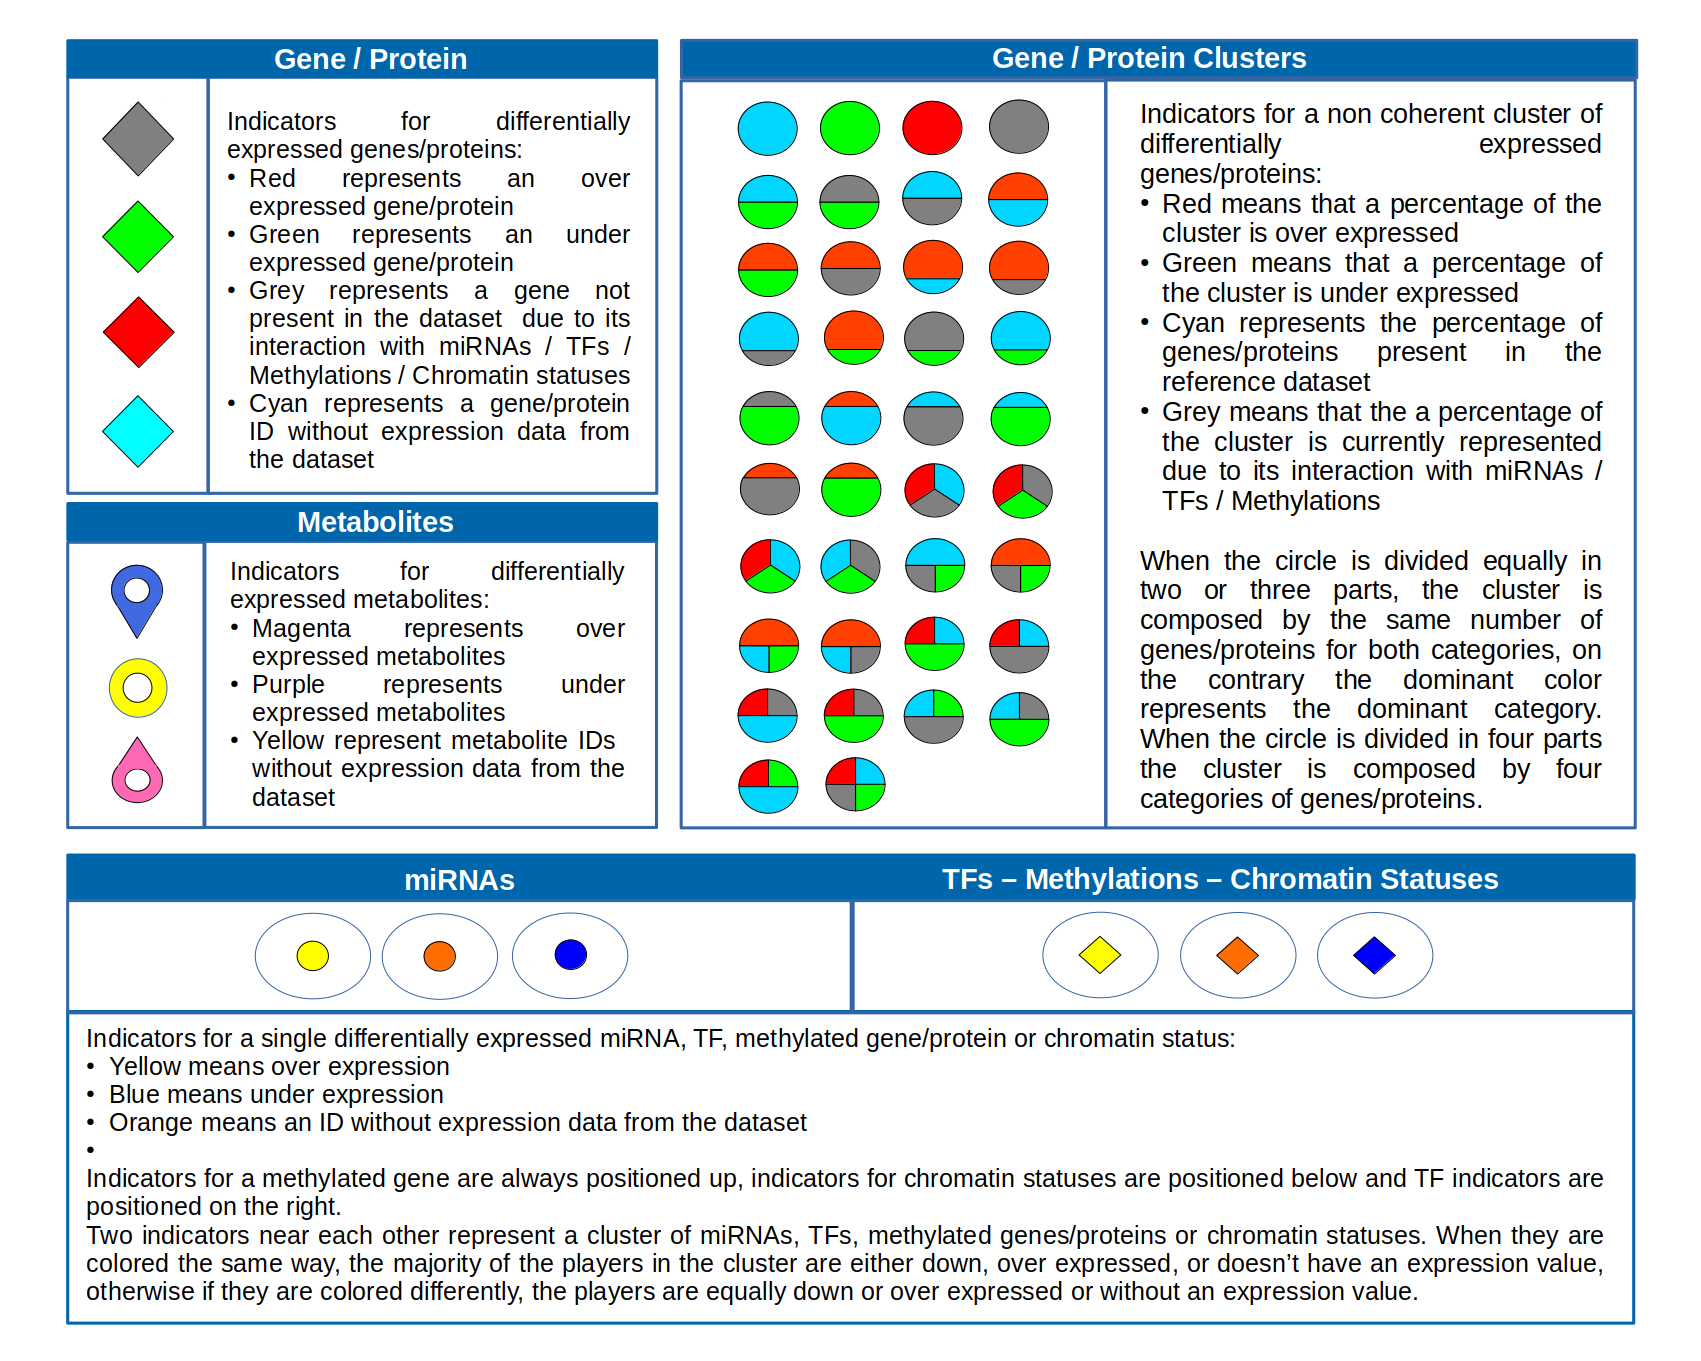
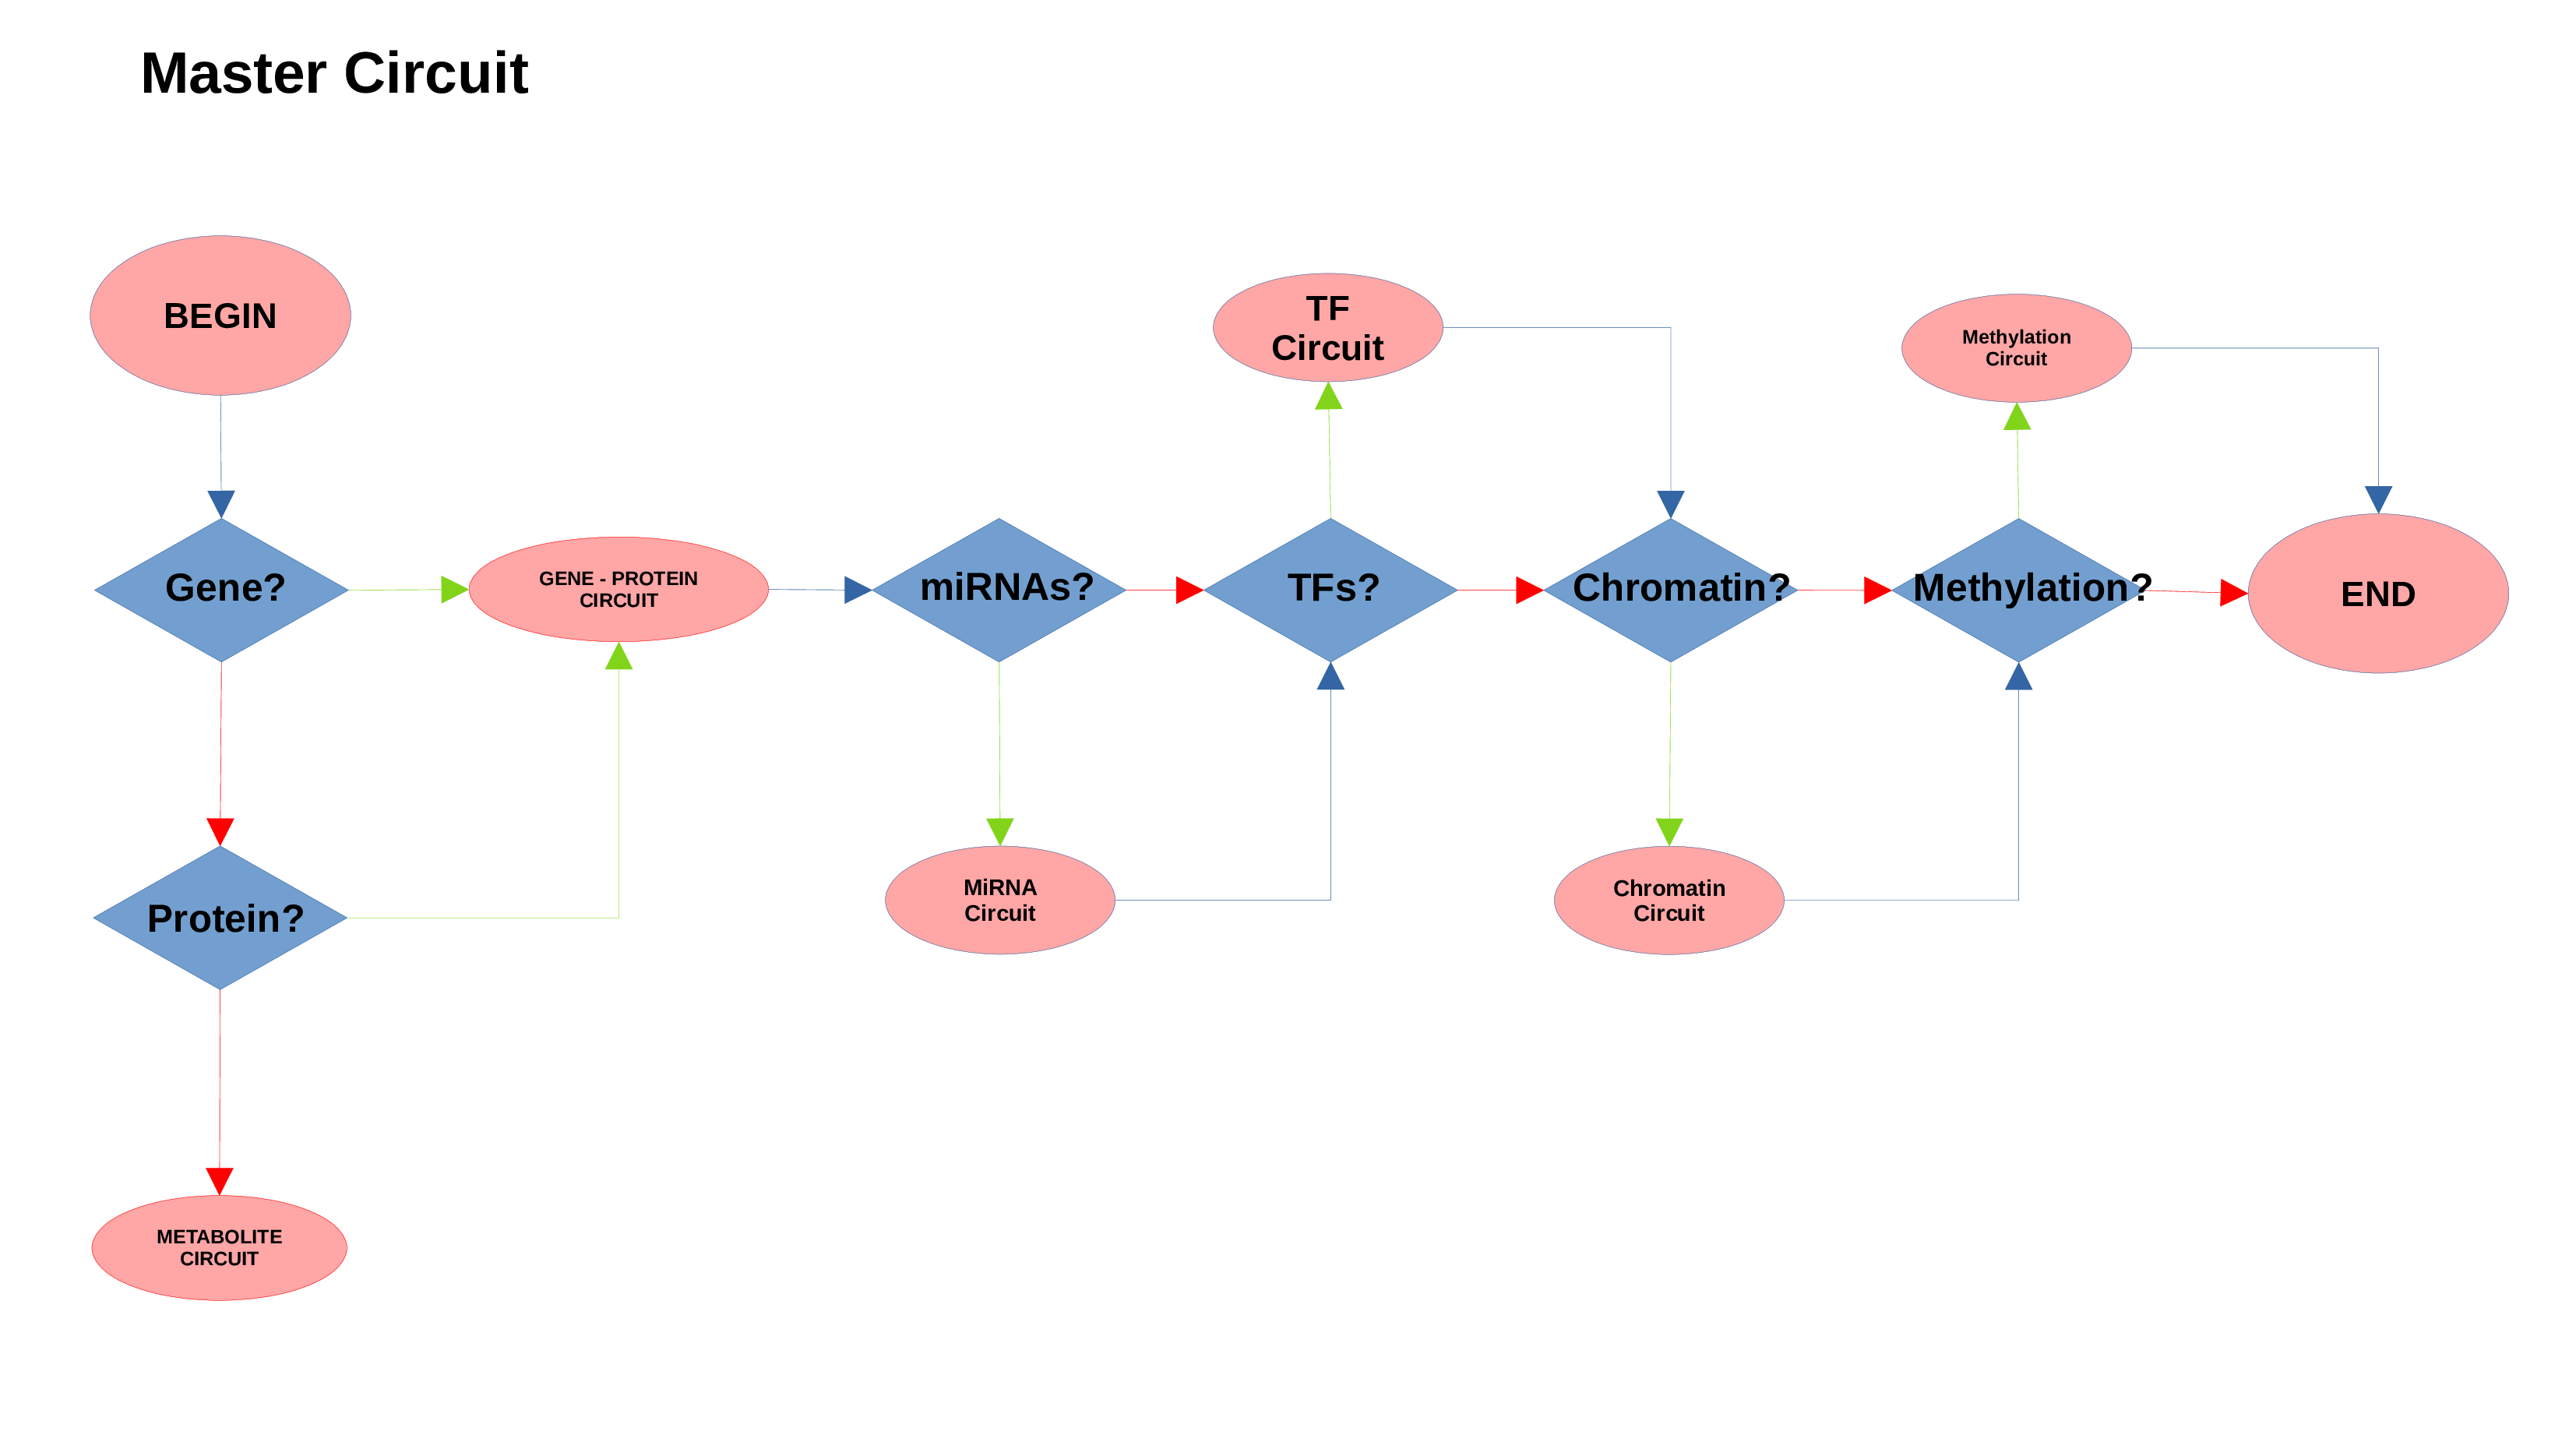
Gene/Protein Circuit
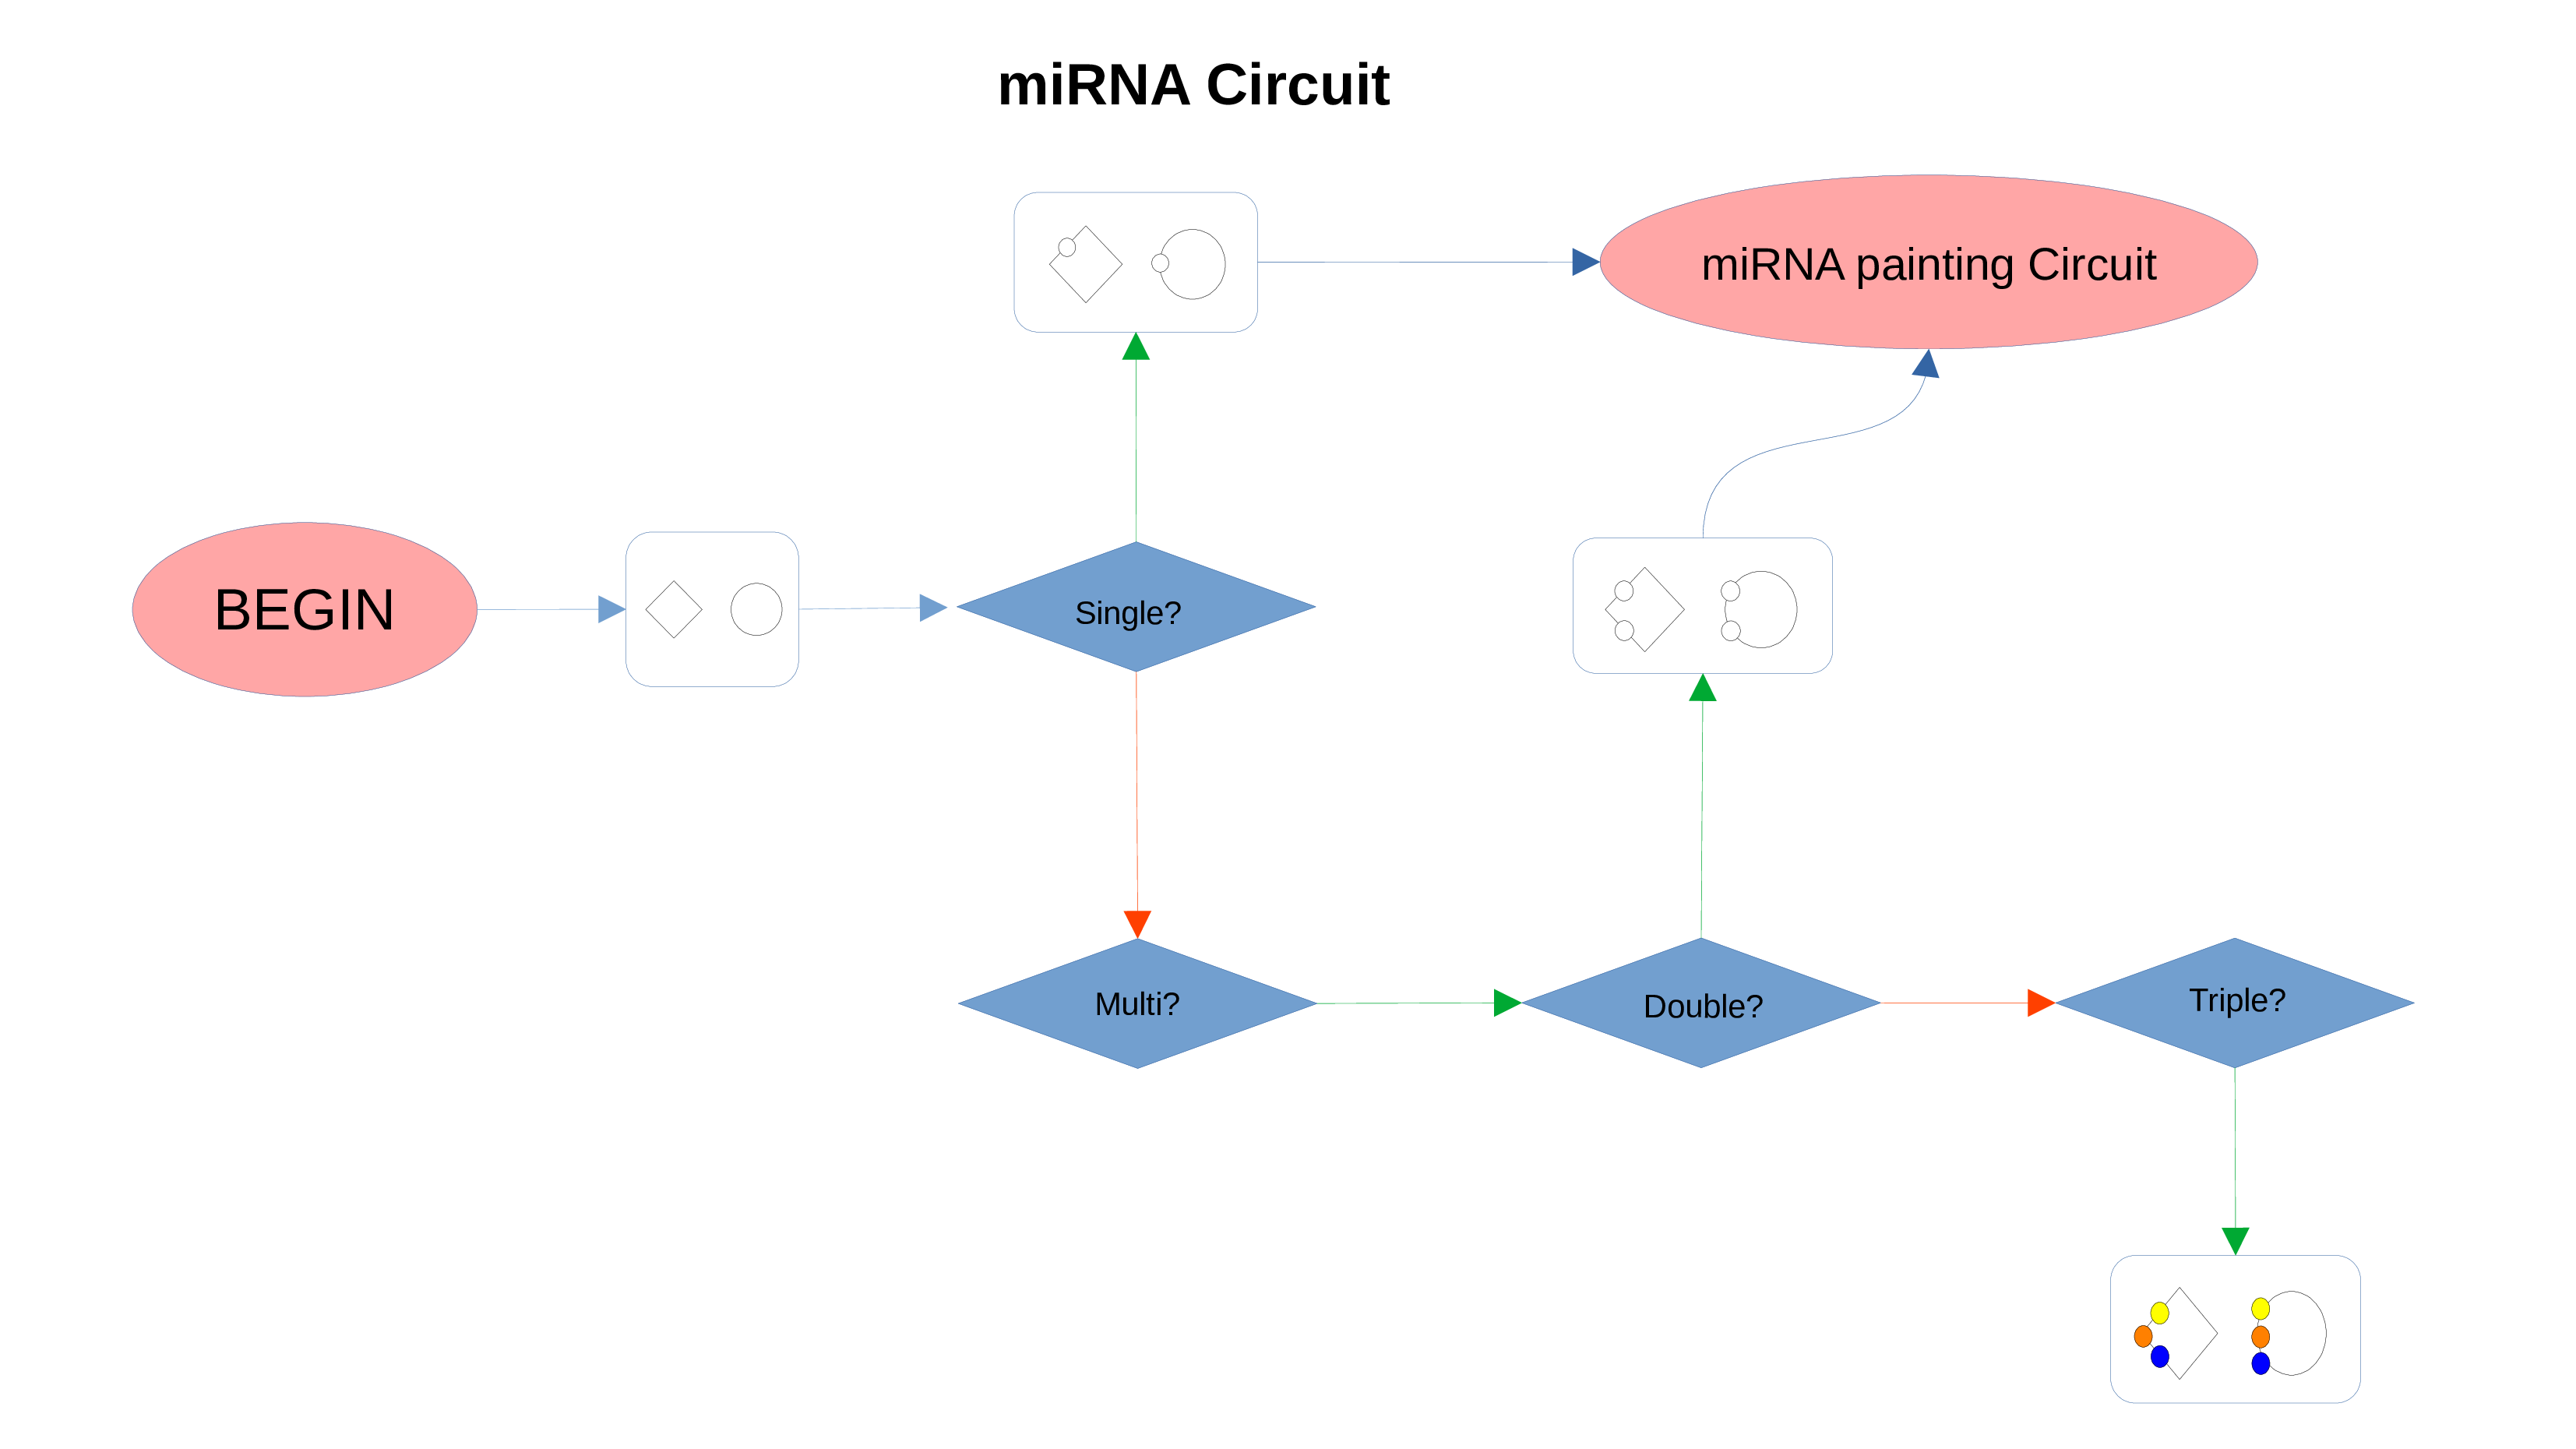
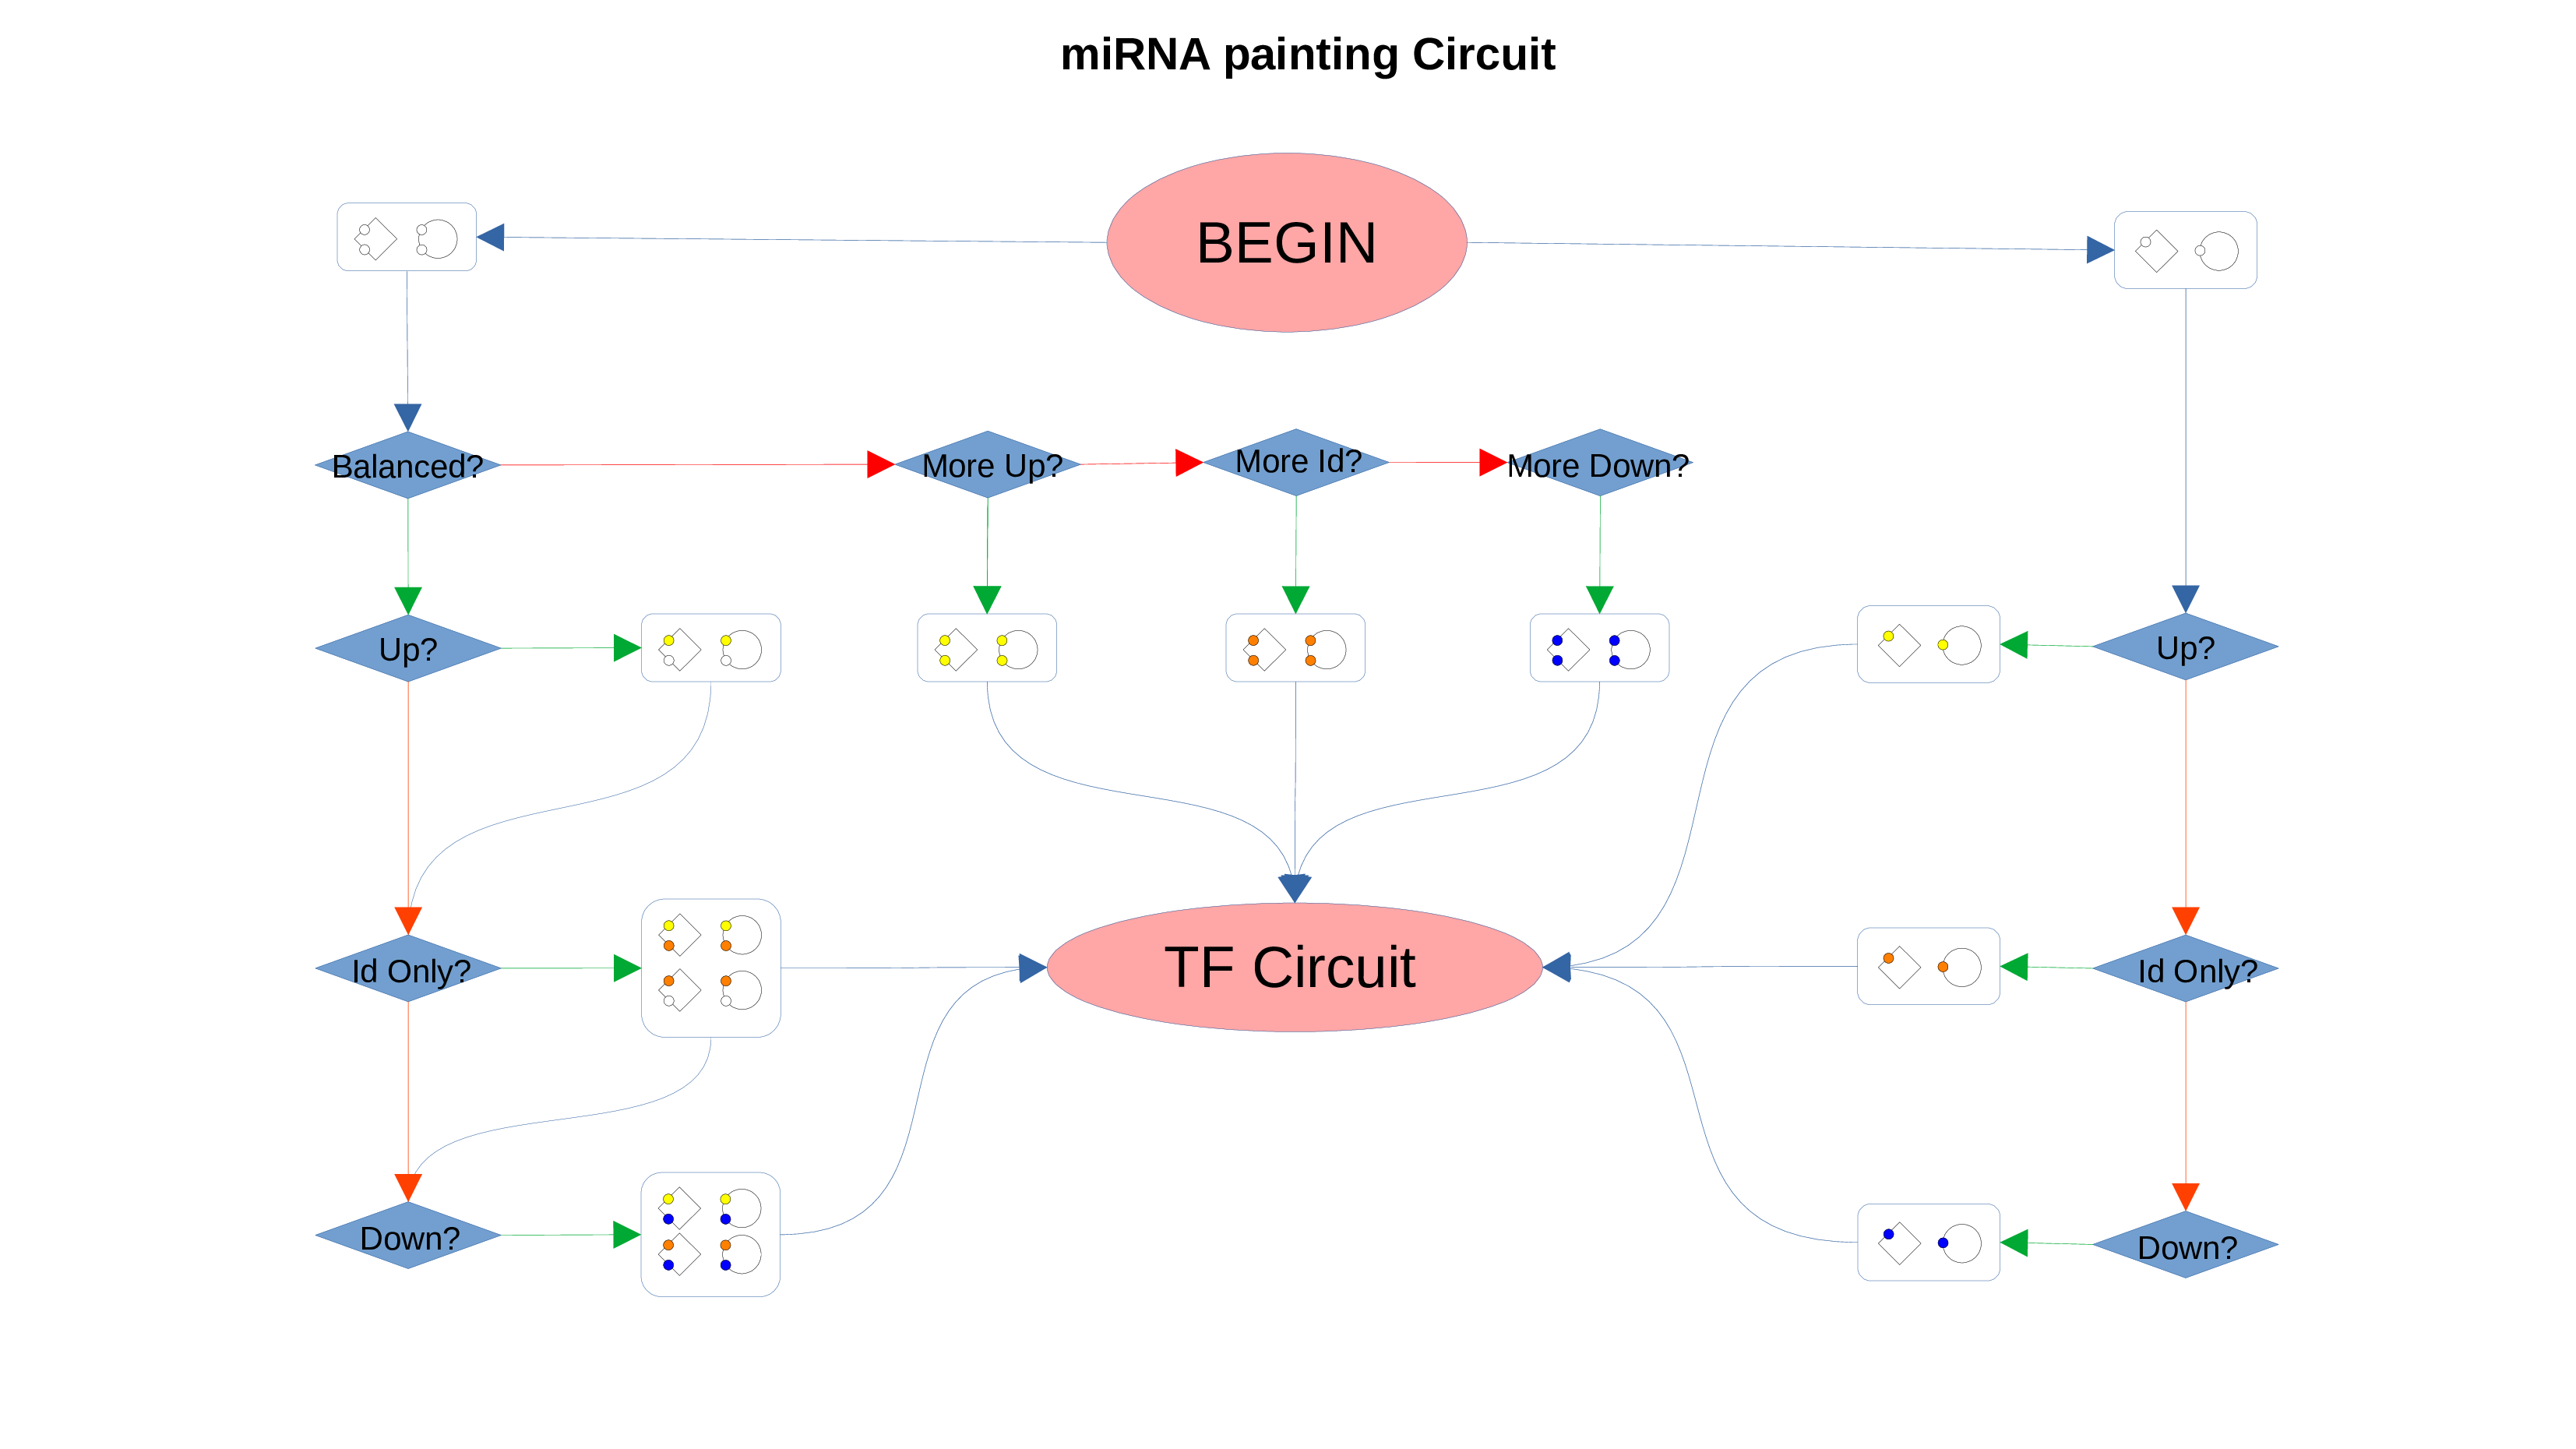
miRNAs Circuit
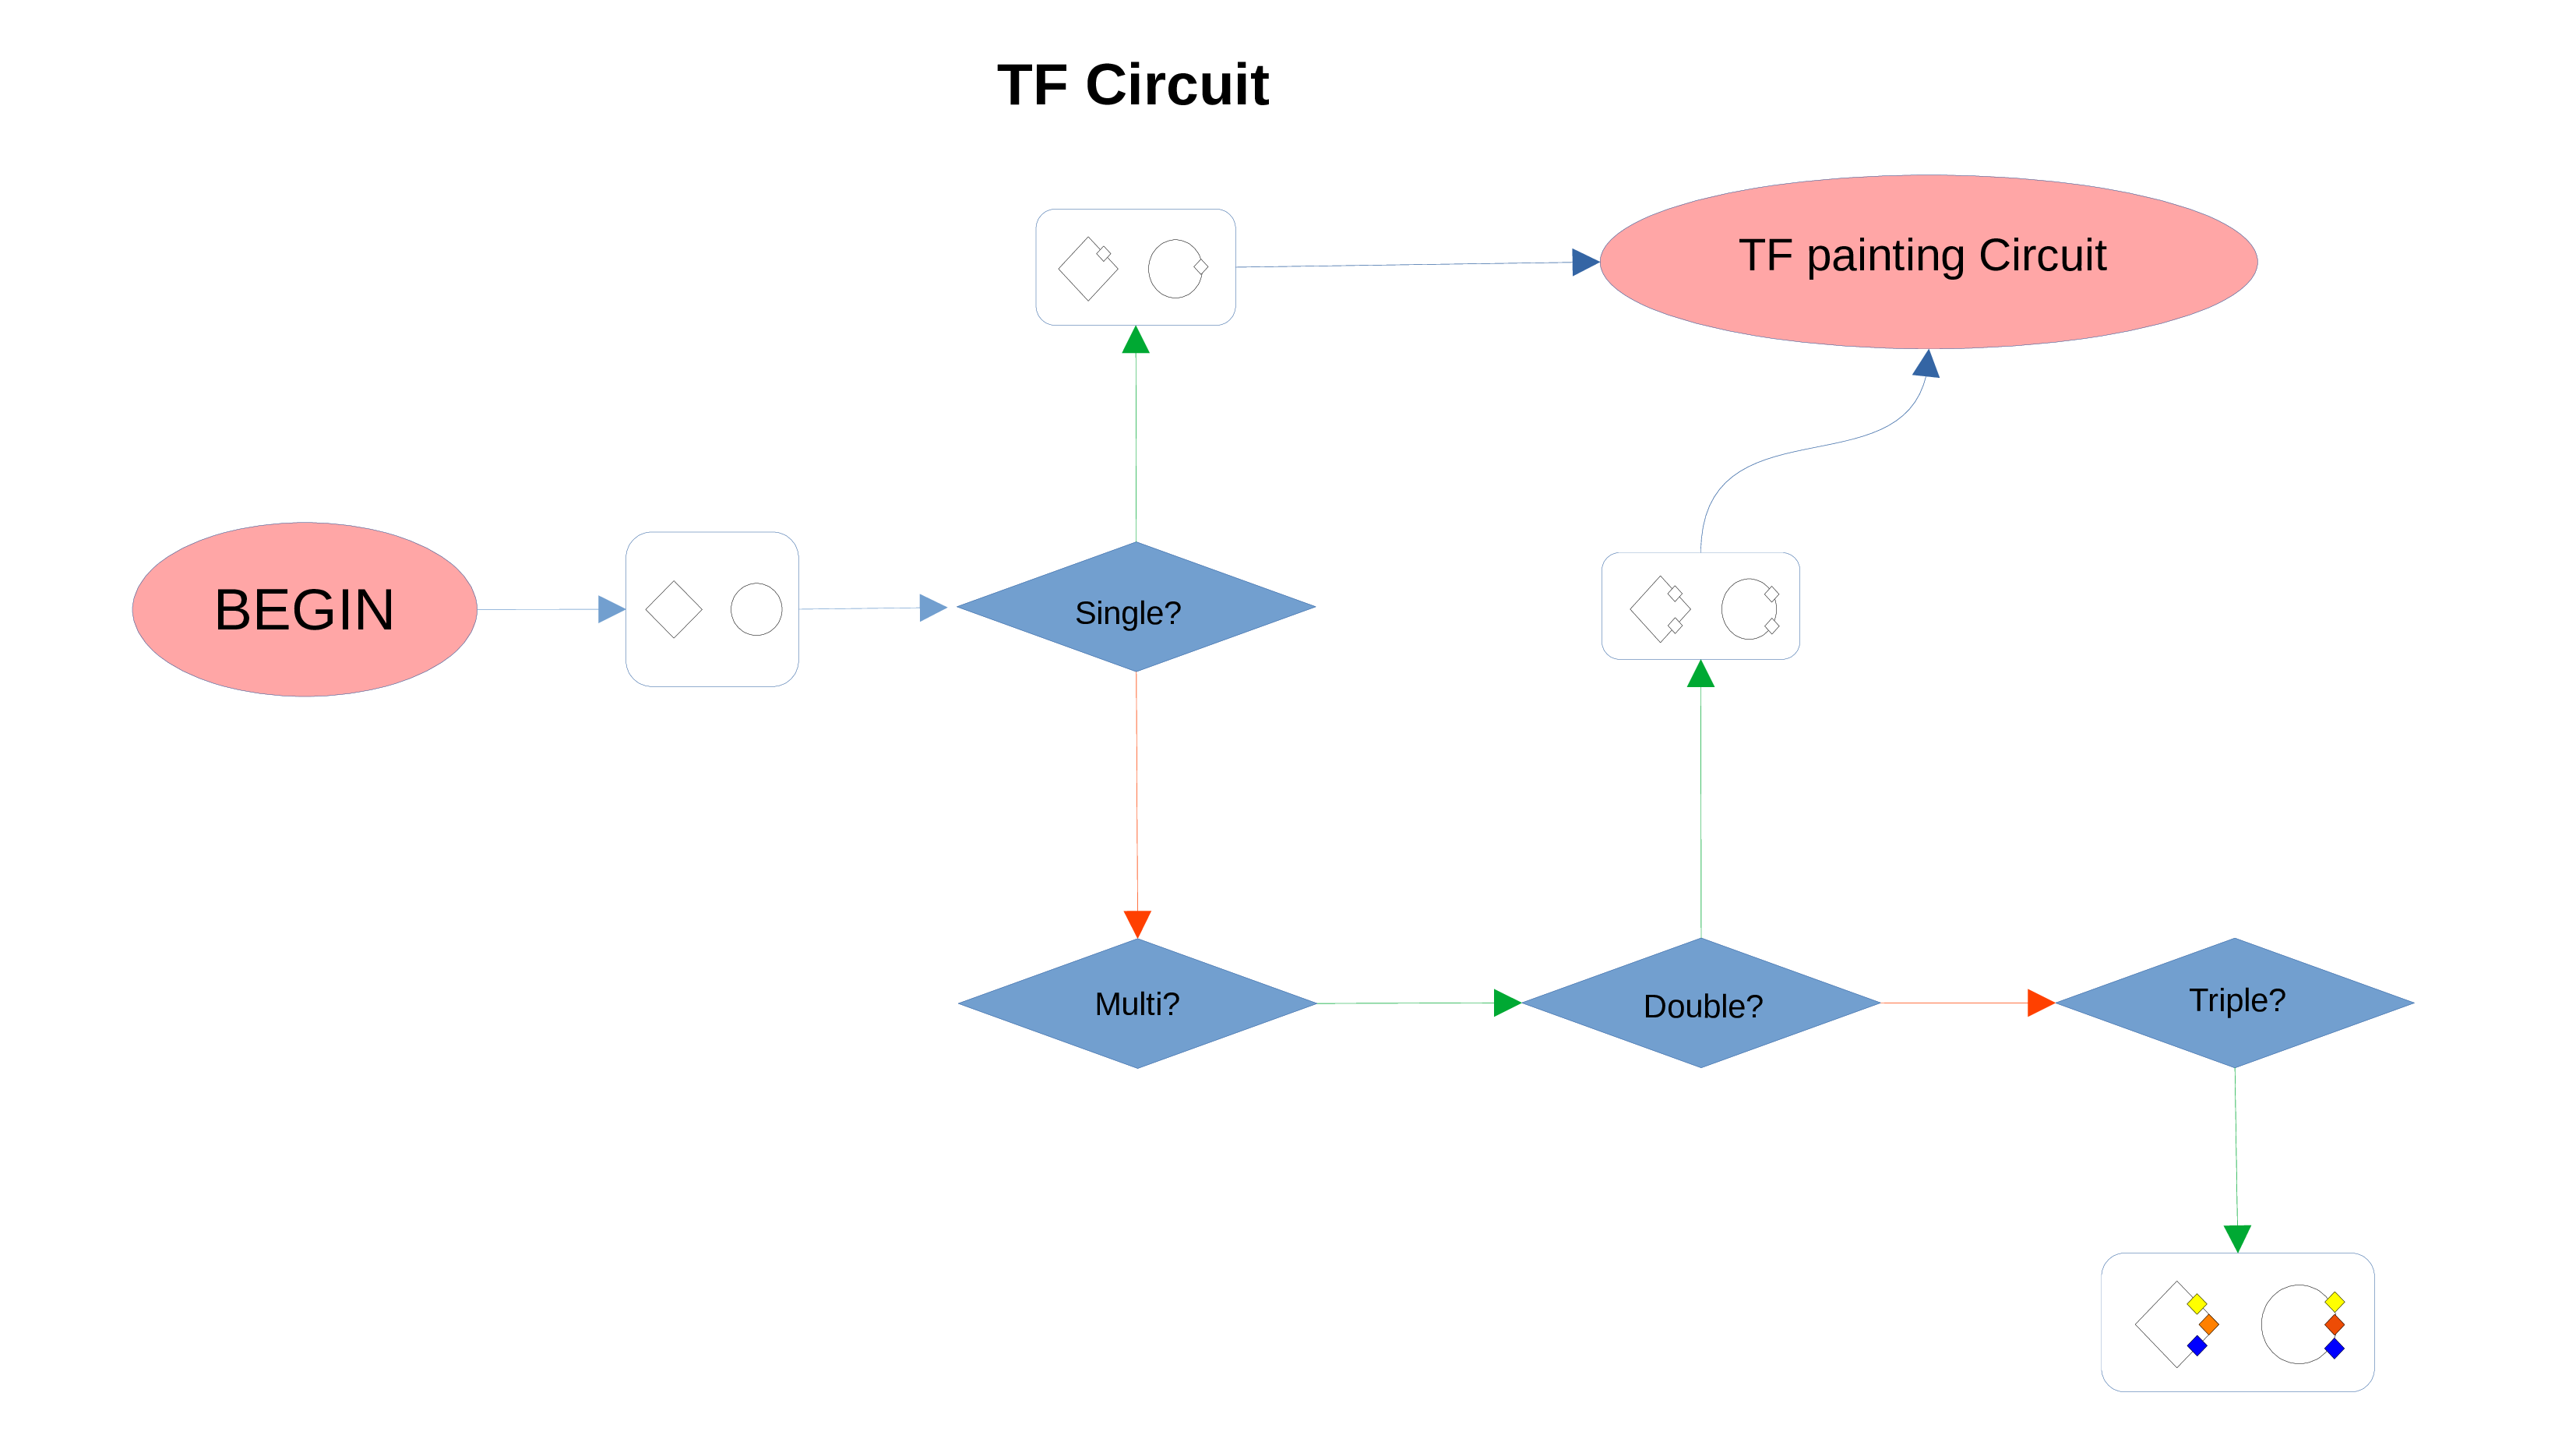
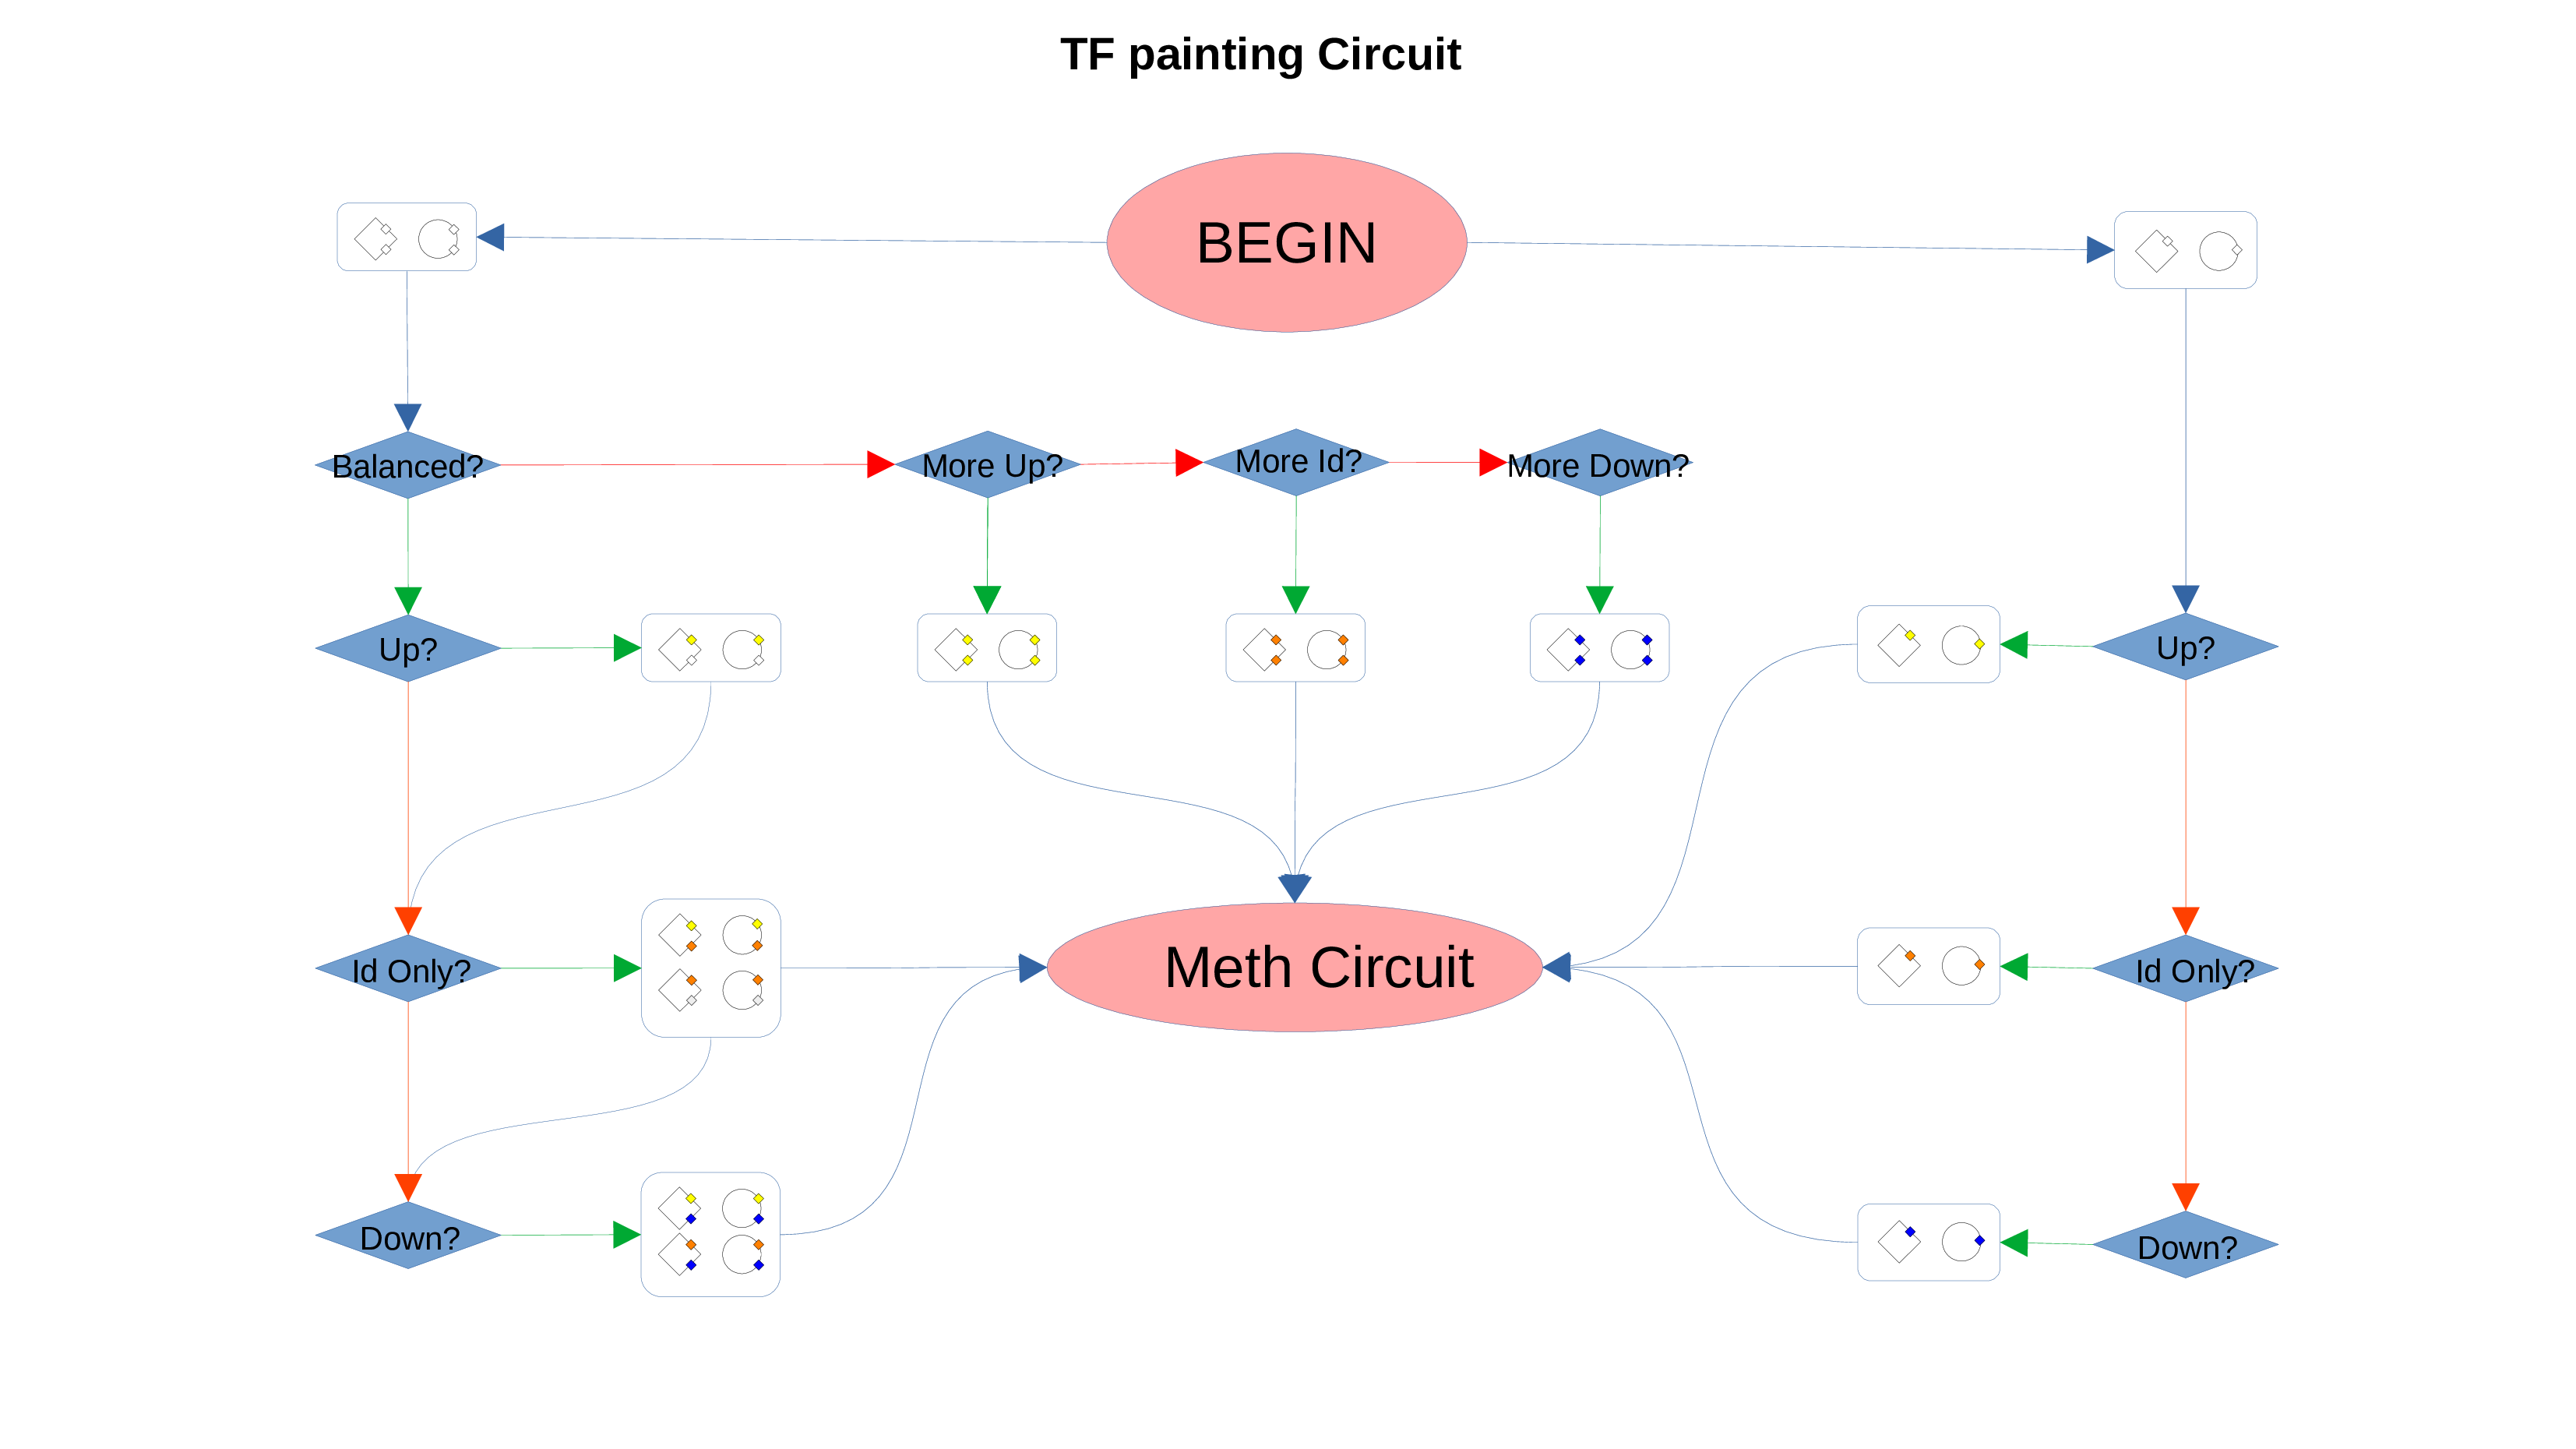
Transcription Factors Circuit
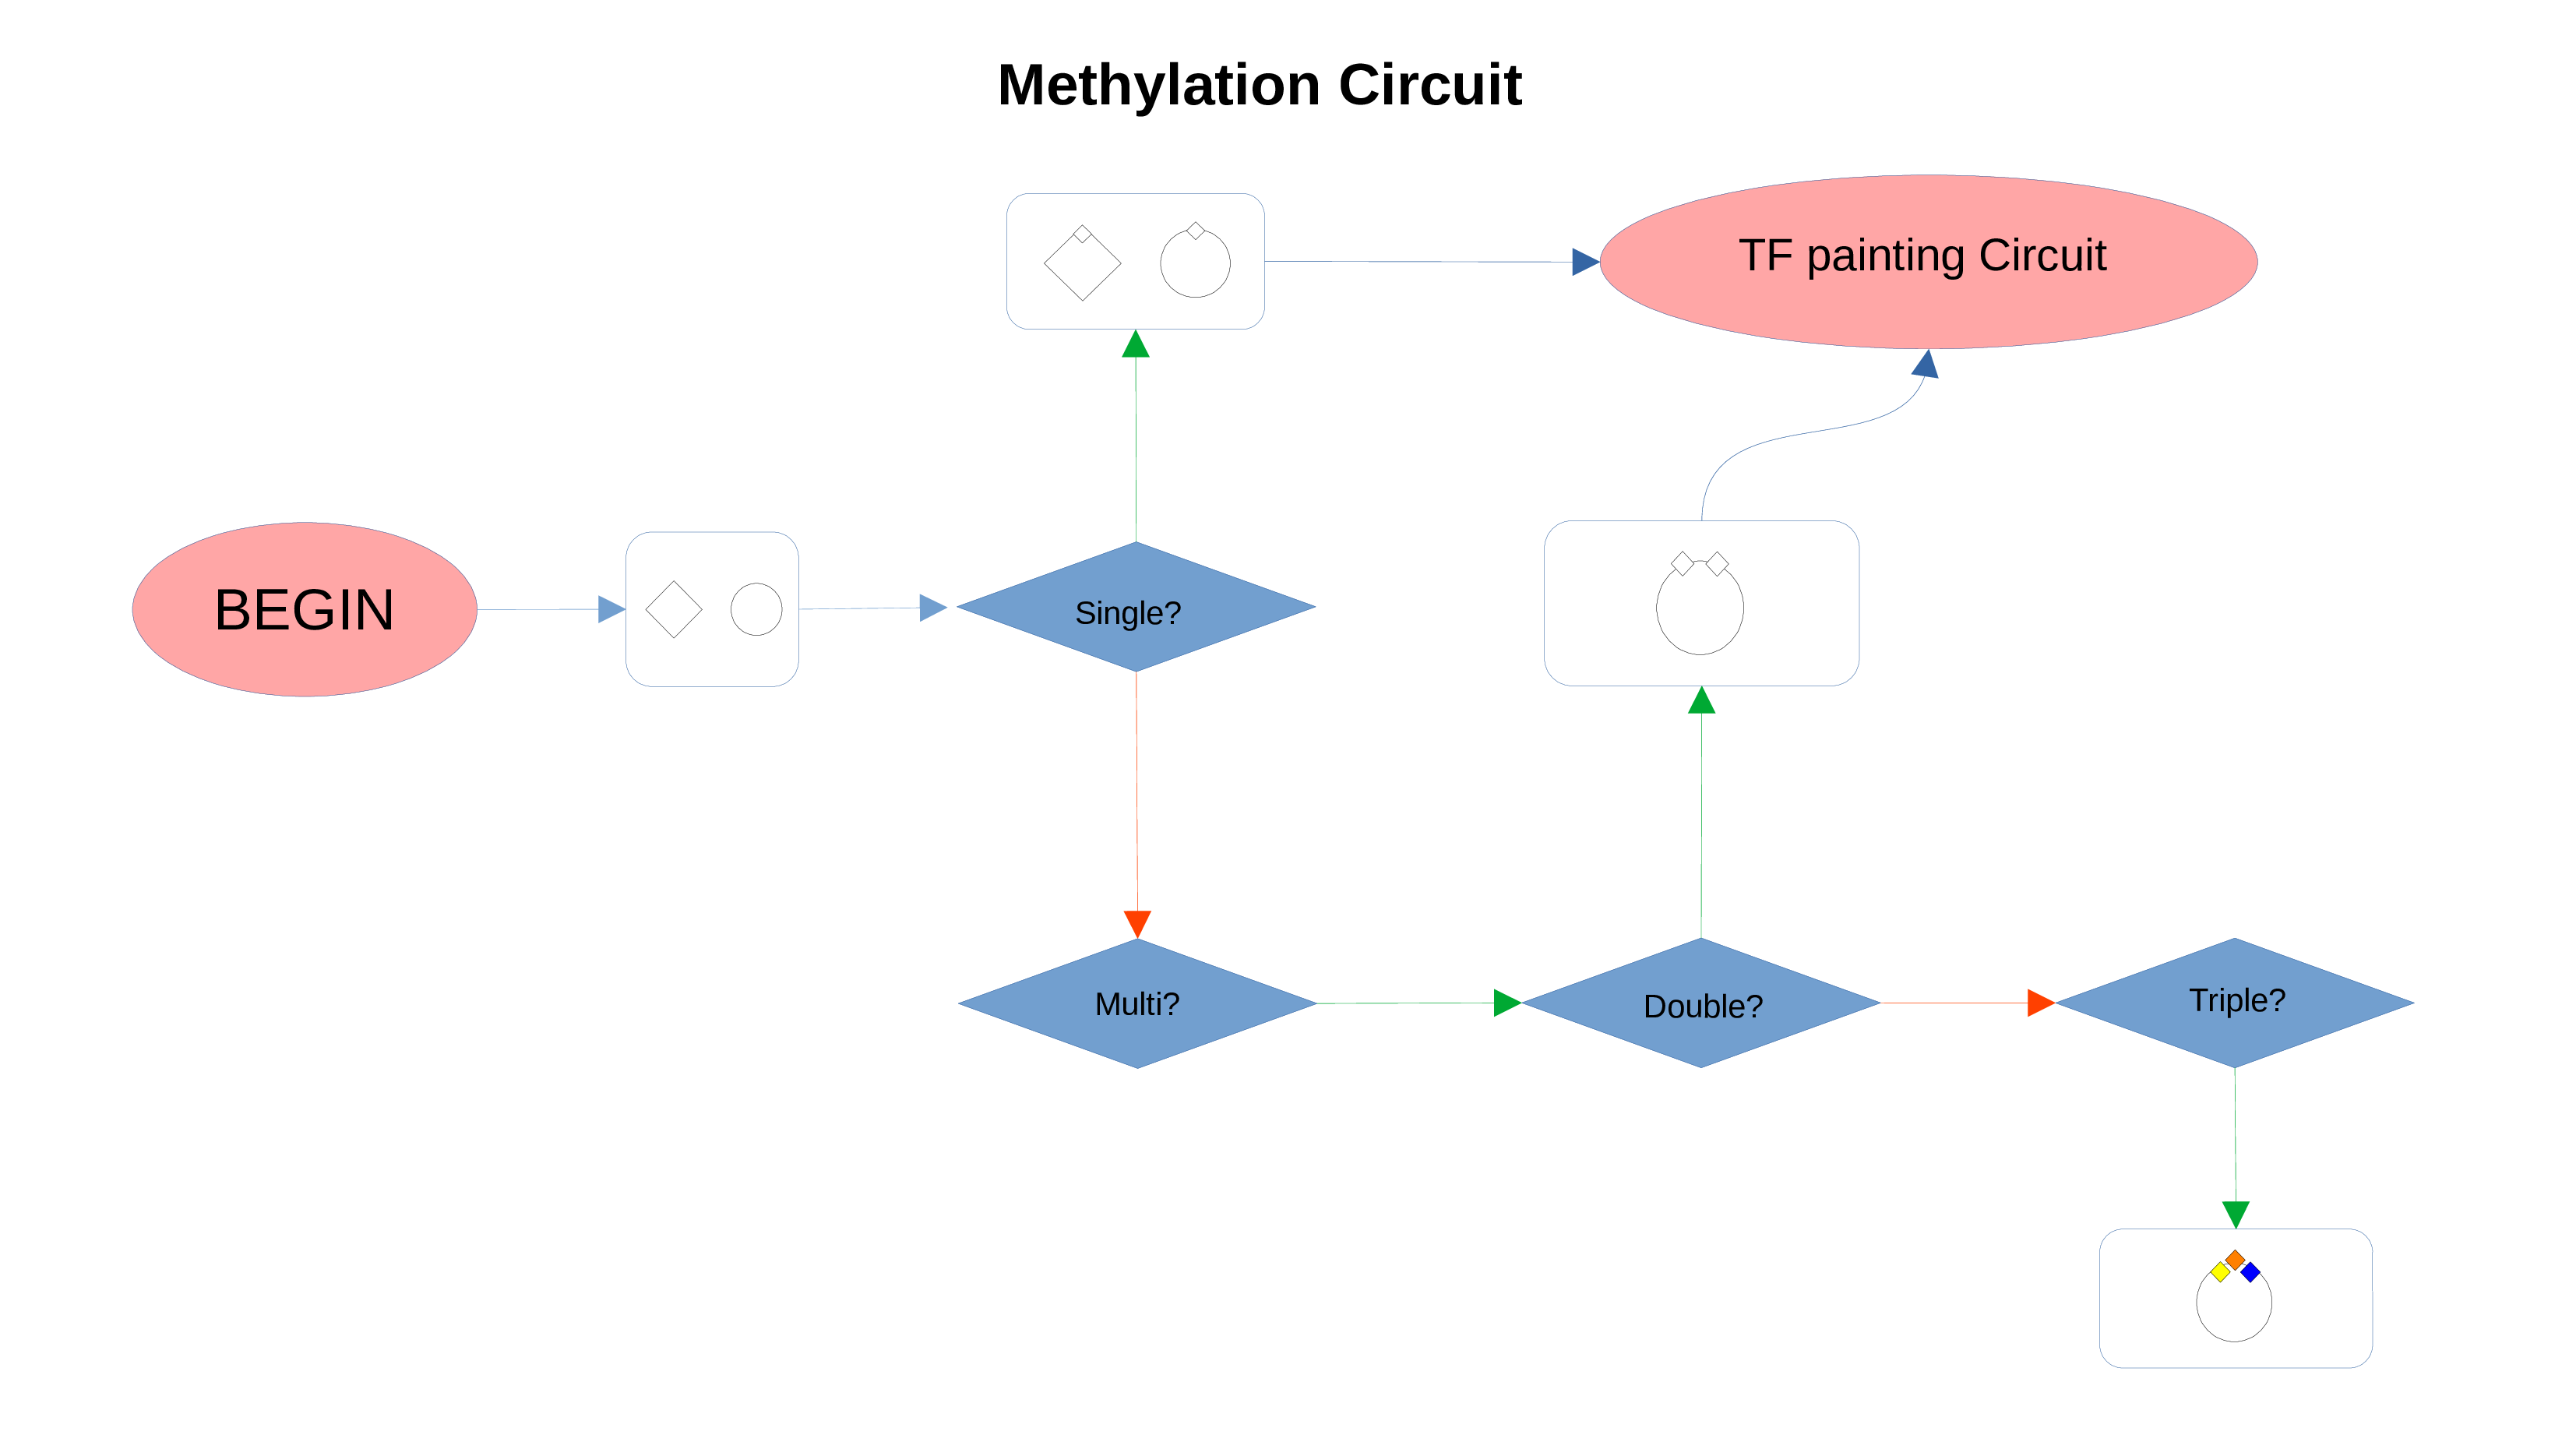
Methylation Circuit
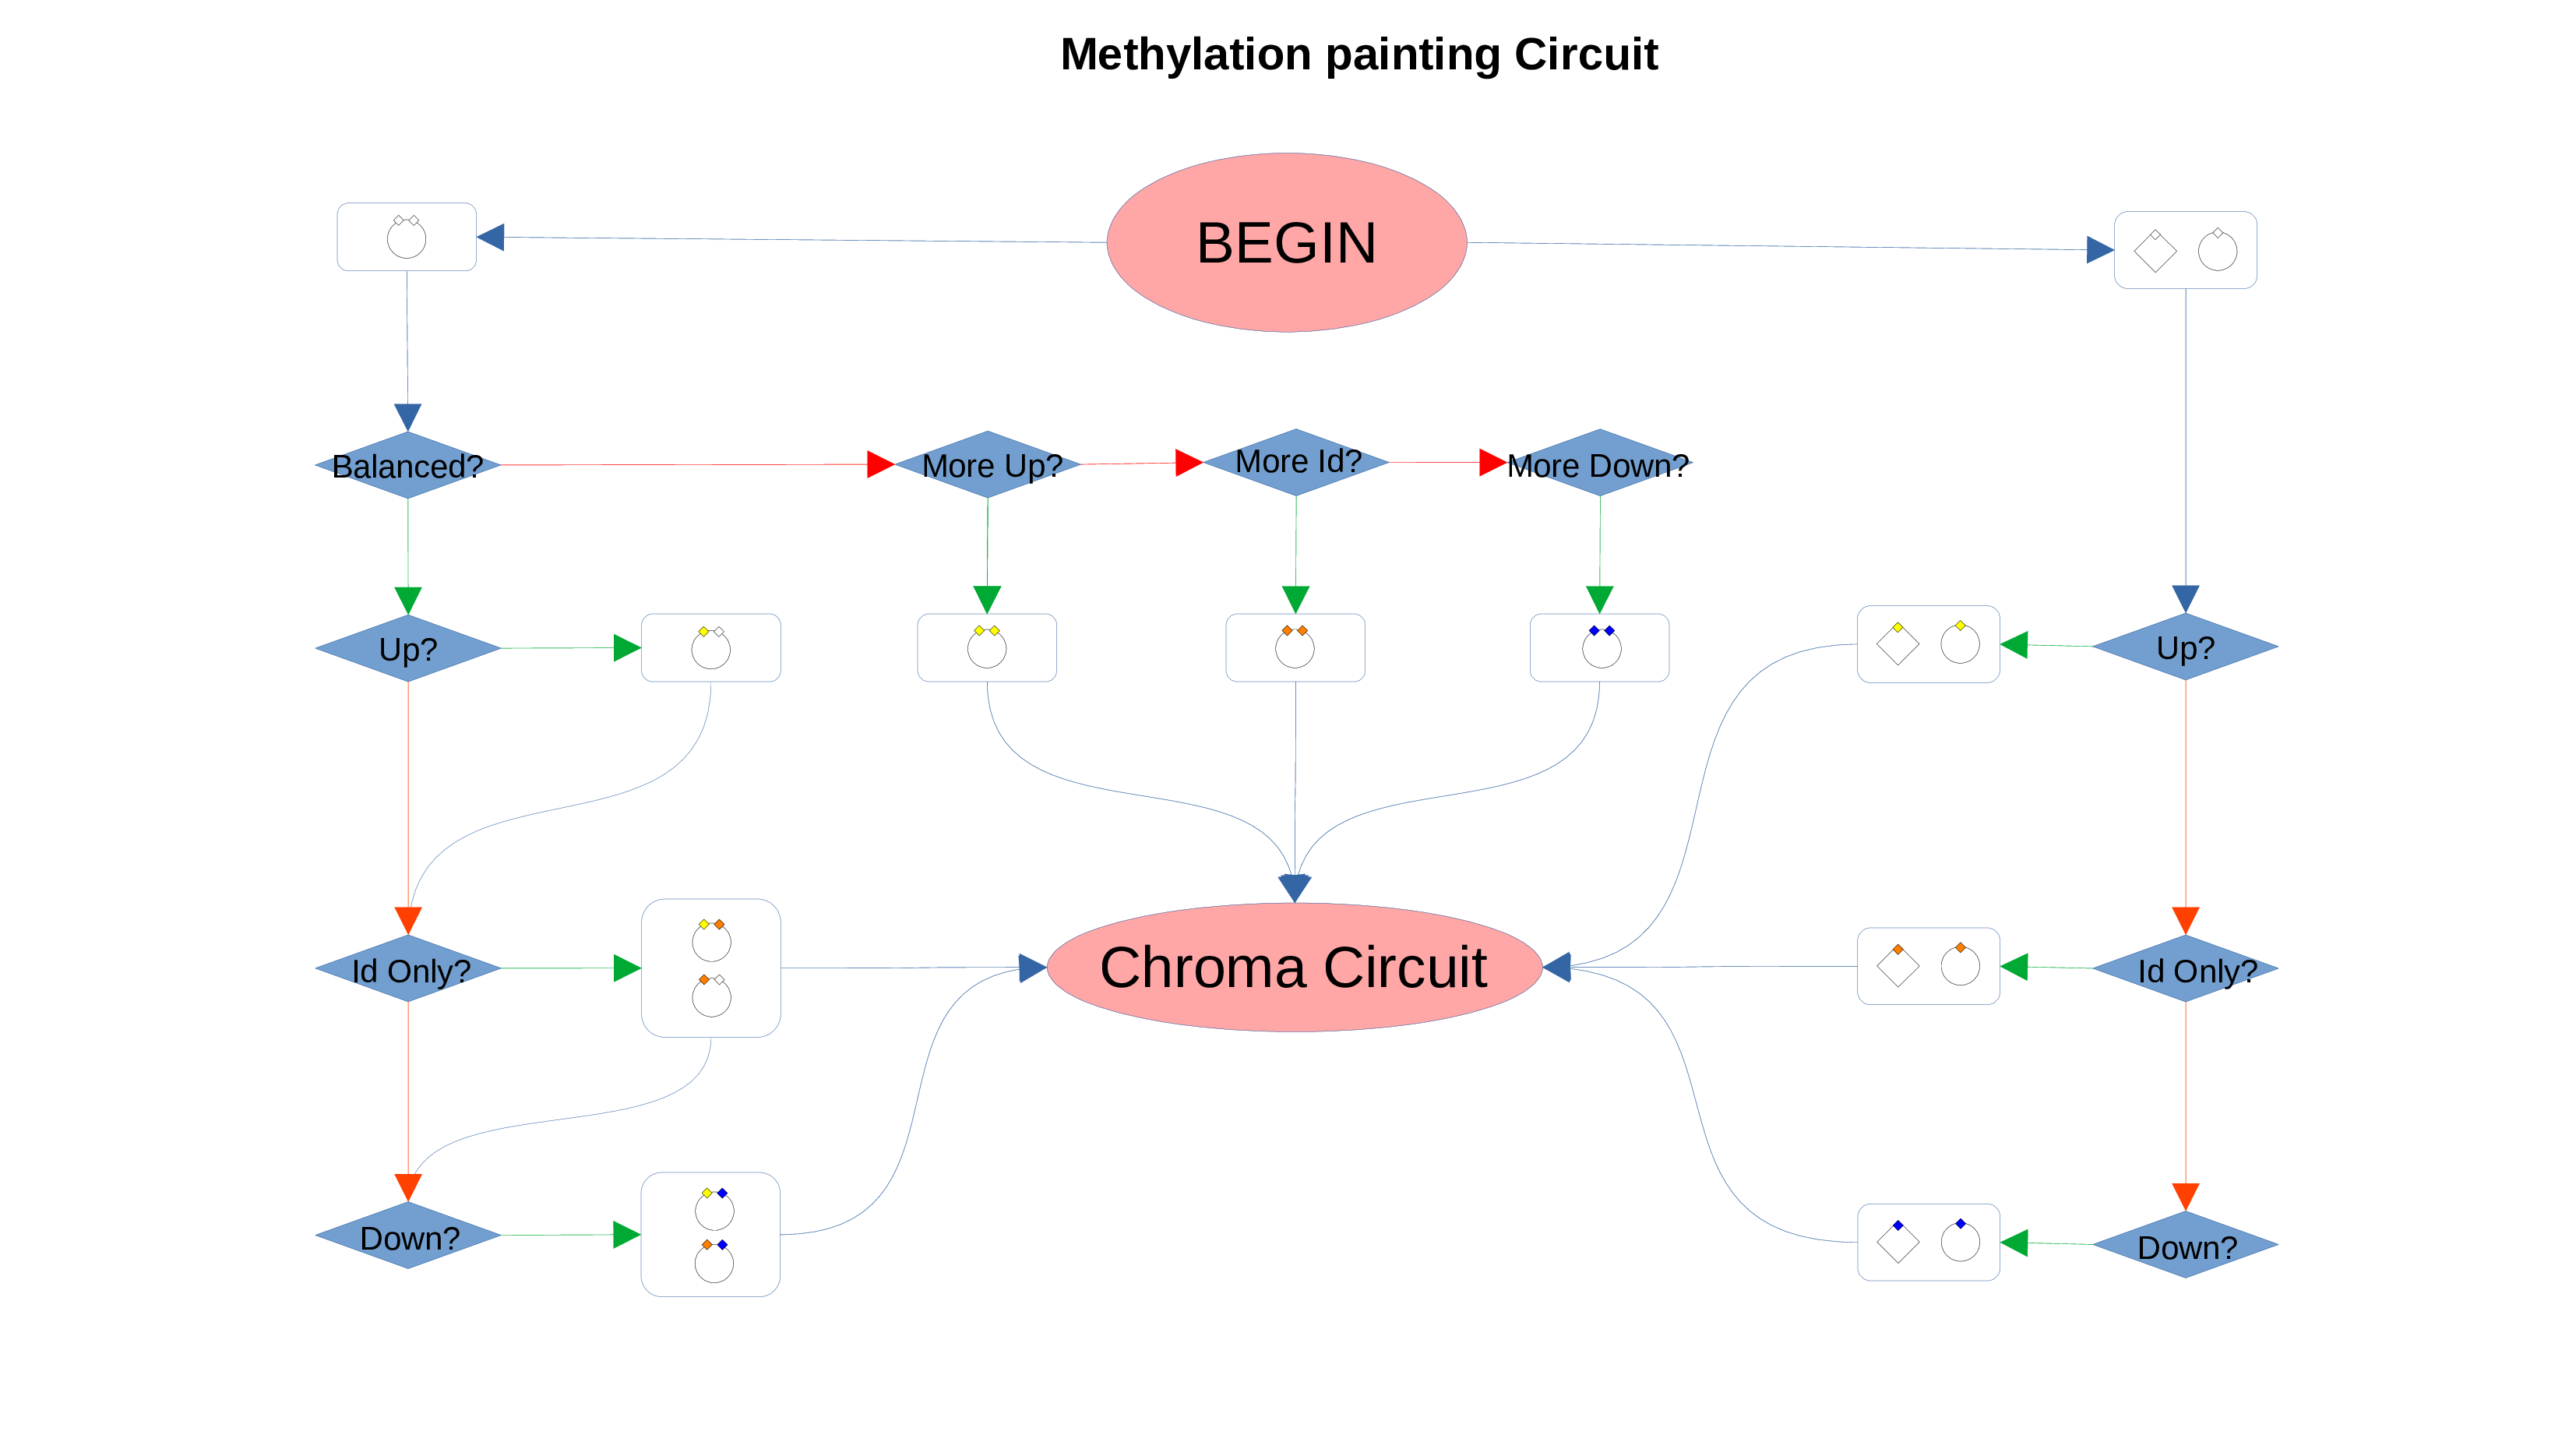
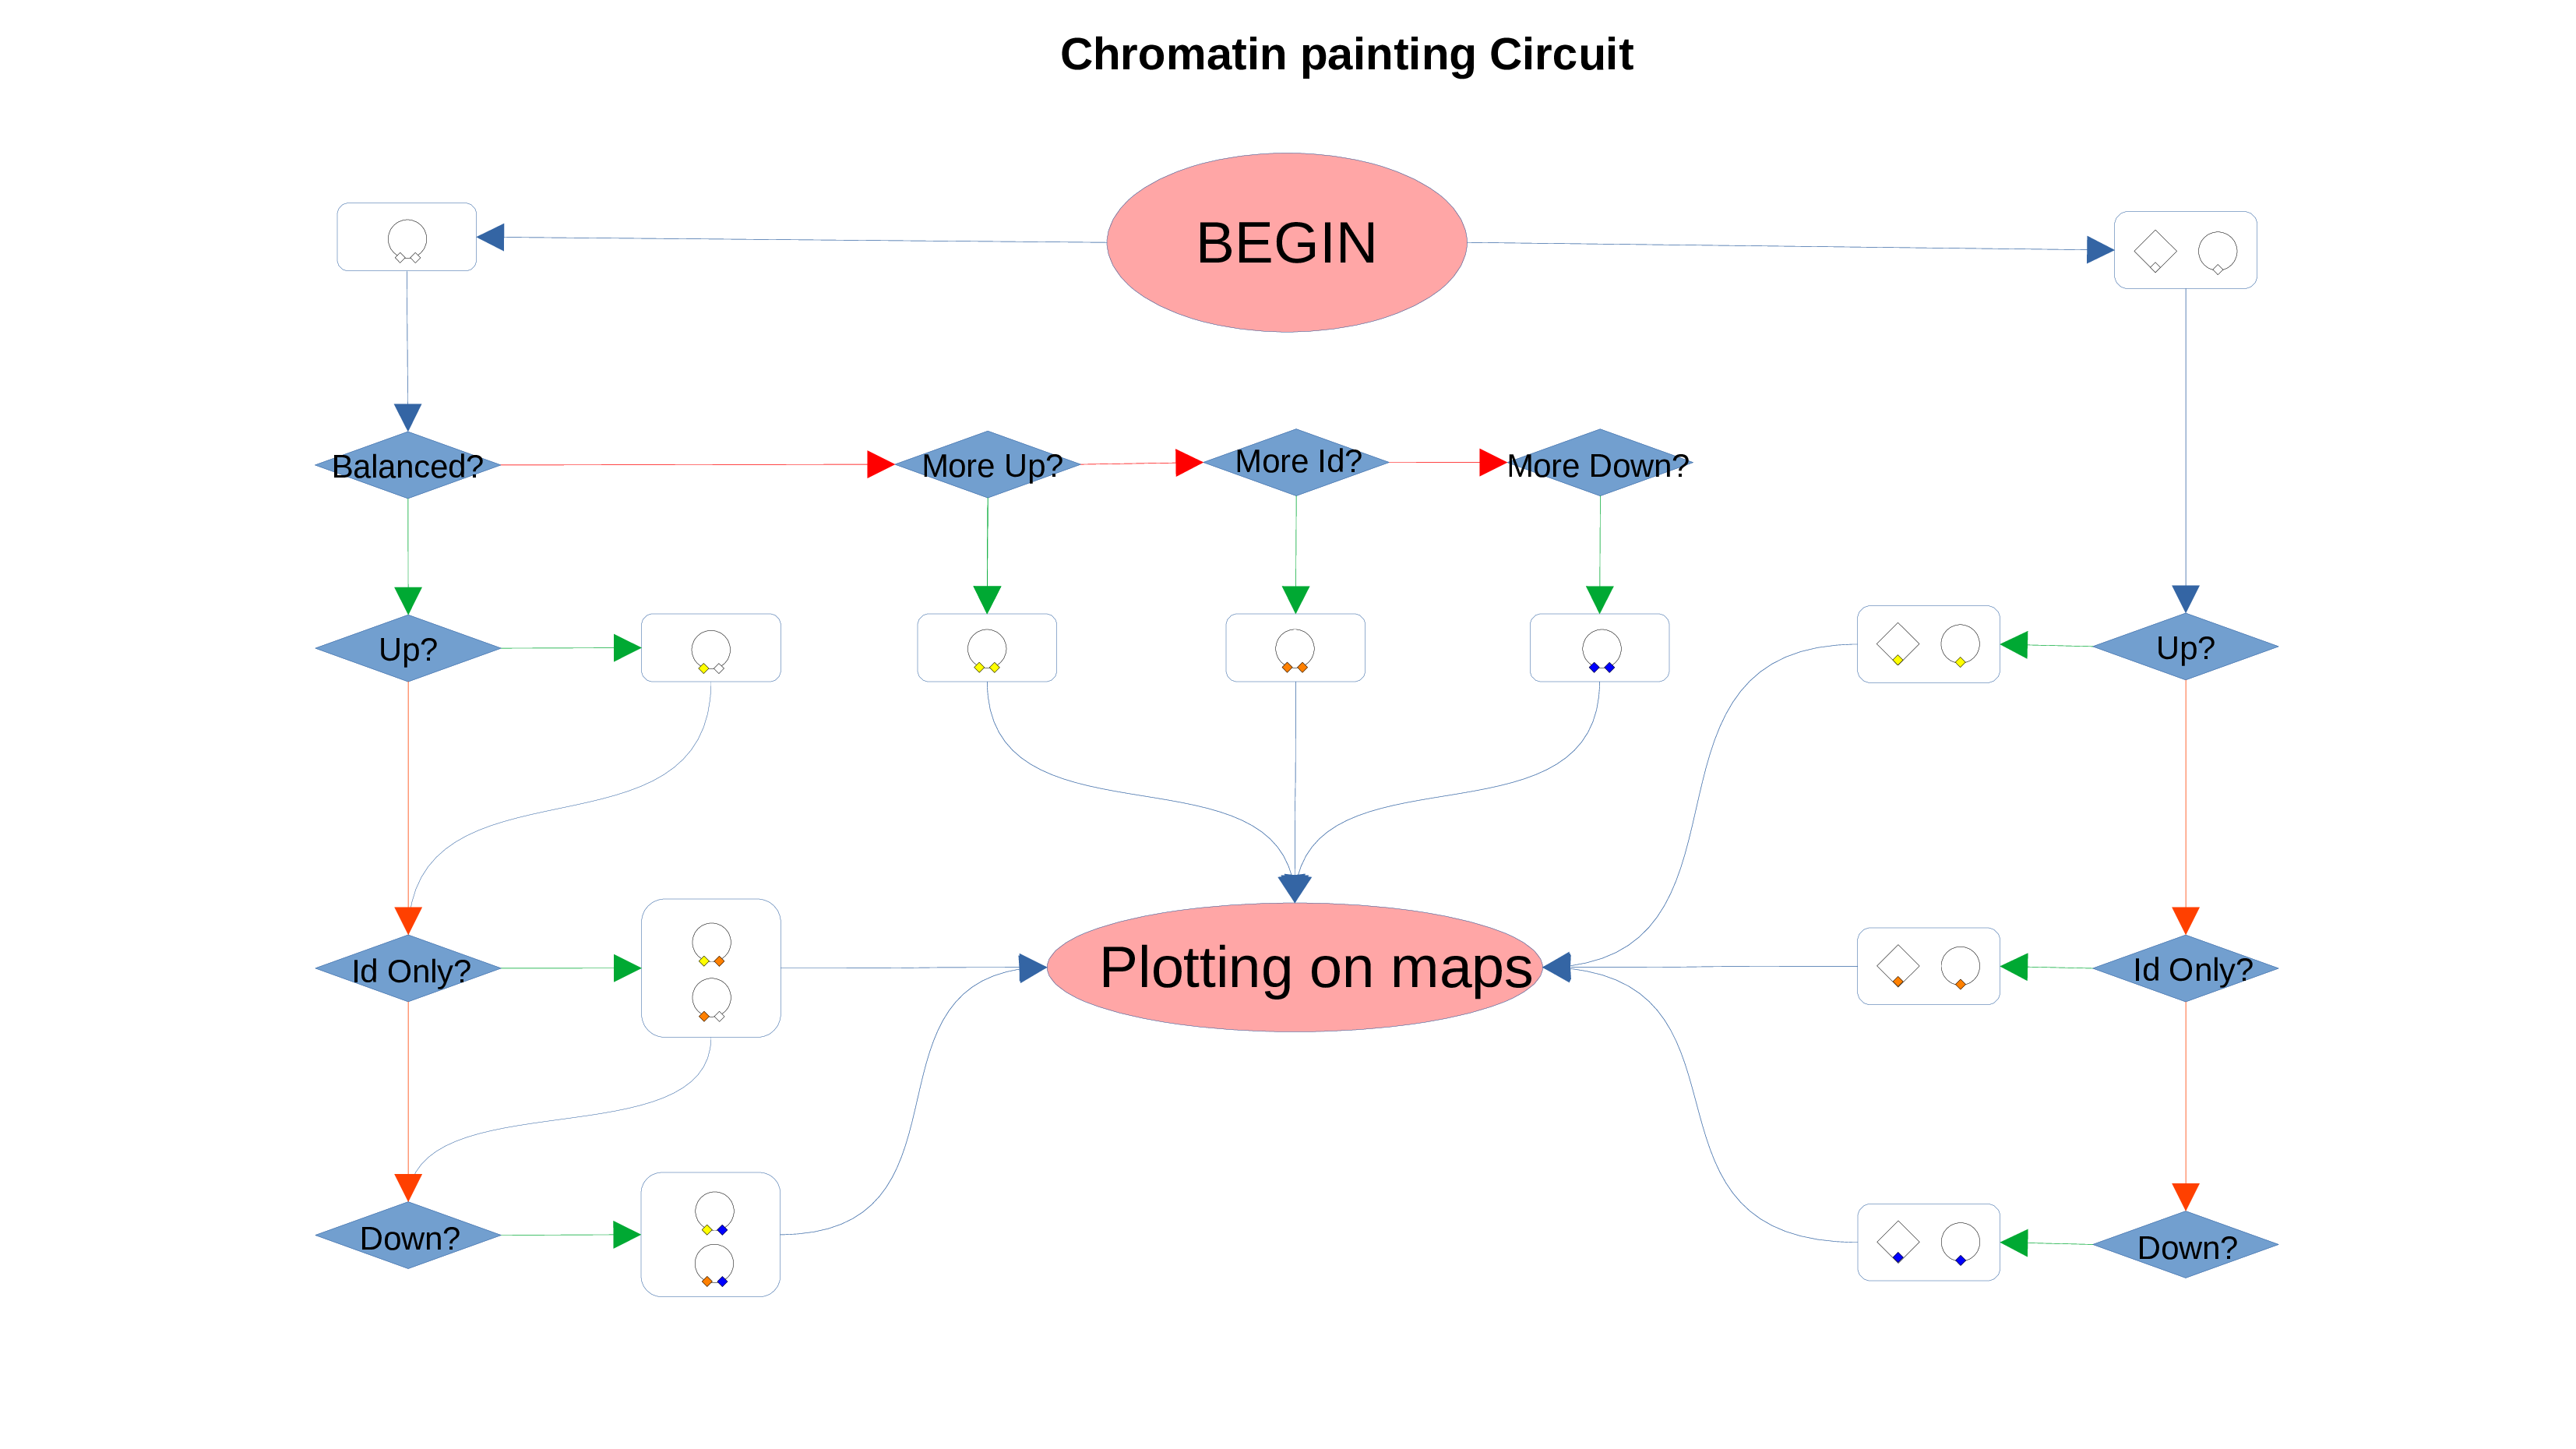
Chromatin Status Circuit